Why Your Website Feels Slow Even on Fast Hosting in 2026
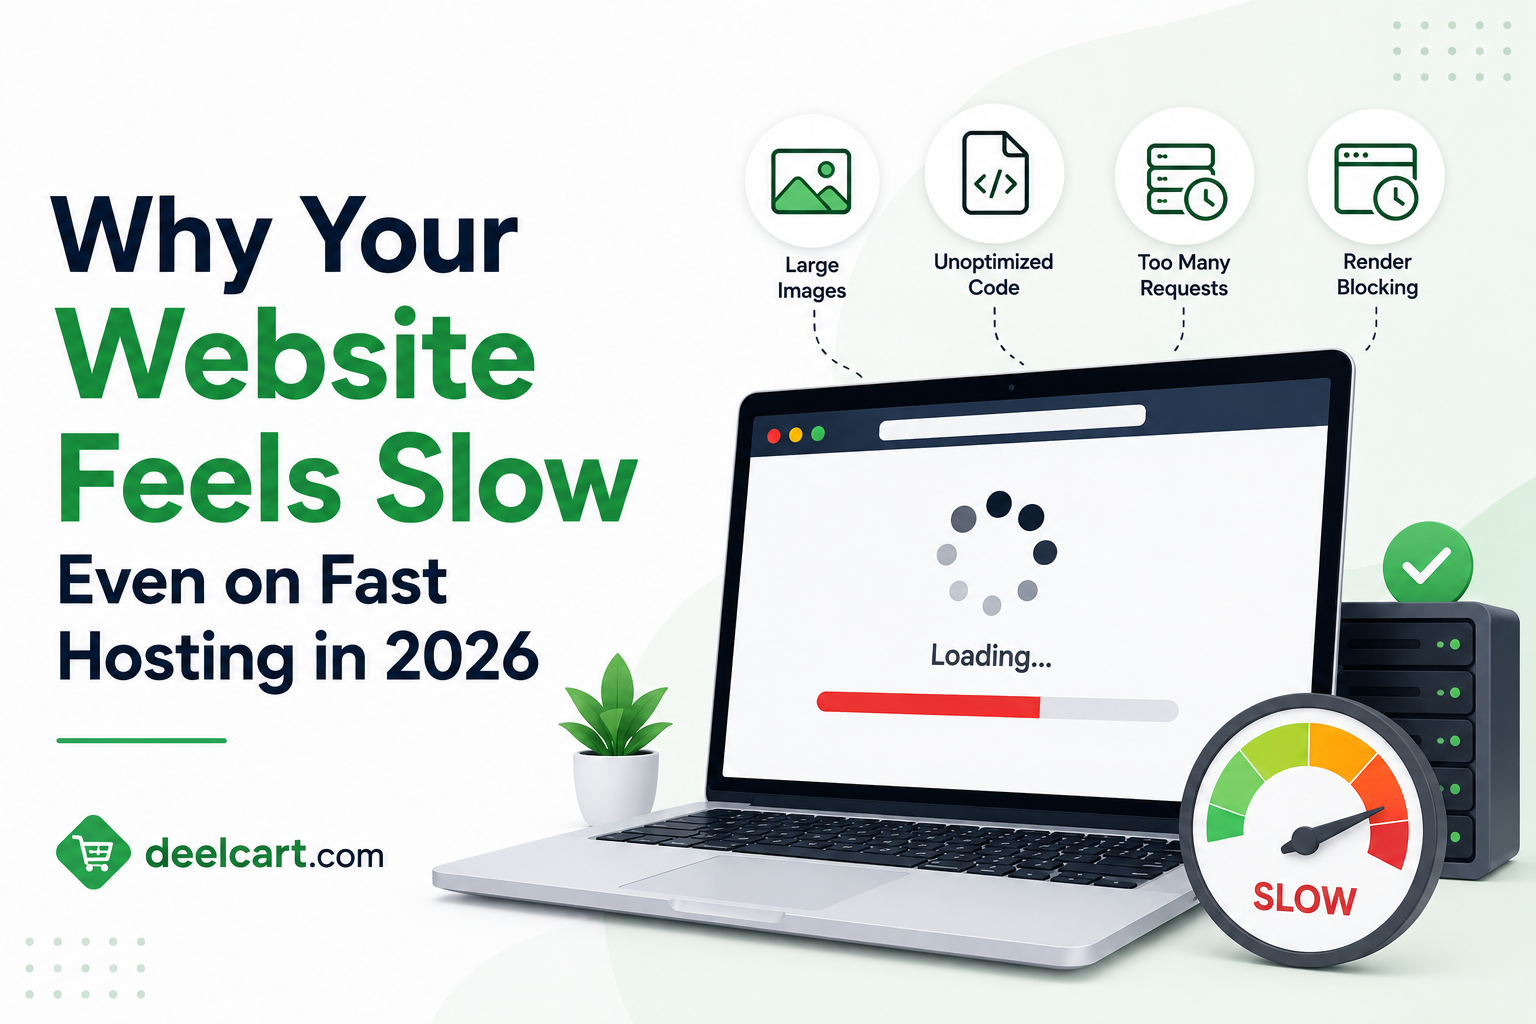
This is one of the most frustrating situations in web development. The hosting is not the problem. The problem is almost always something in the website itself — and there are usually several of them stacked on top of each other.
This guide covers the real reasons websites feel slow even on fast hosting in 2026 — and exactly what to do about each one.
Why Hosting Speed Is Only One Piece of the Puzzle
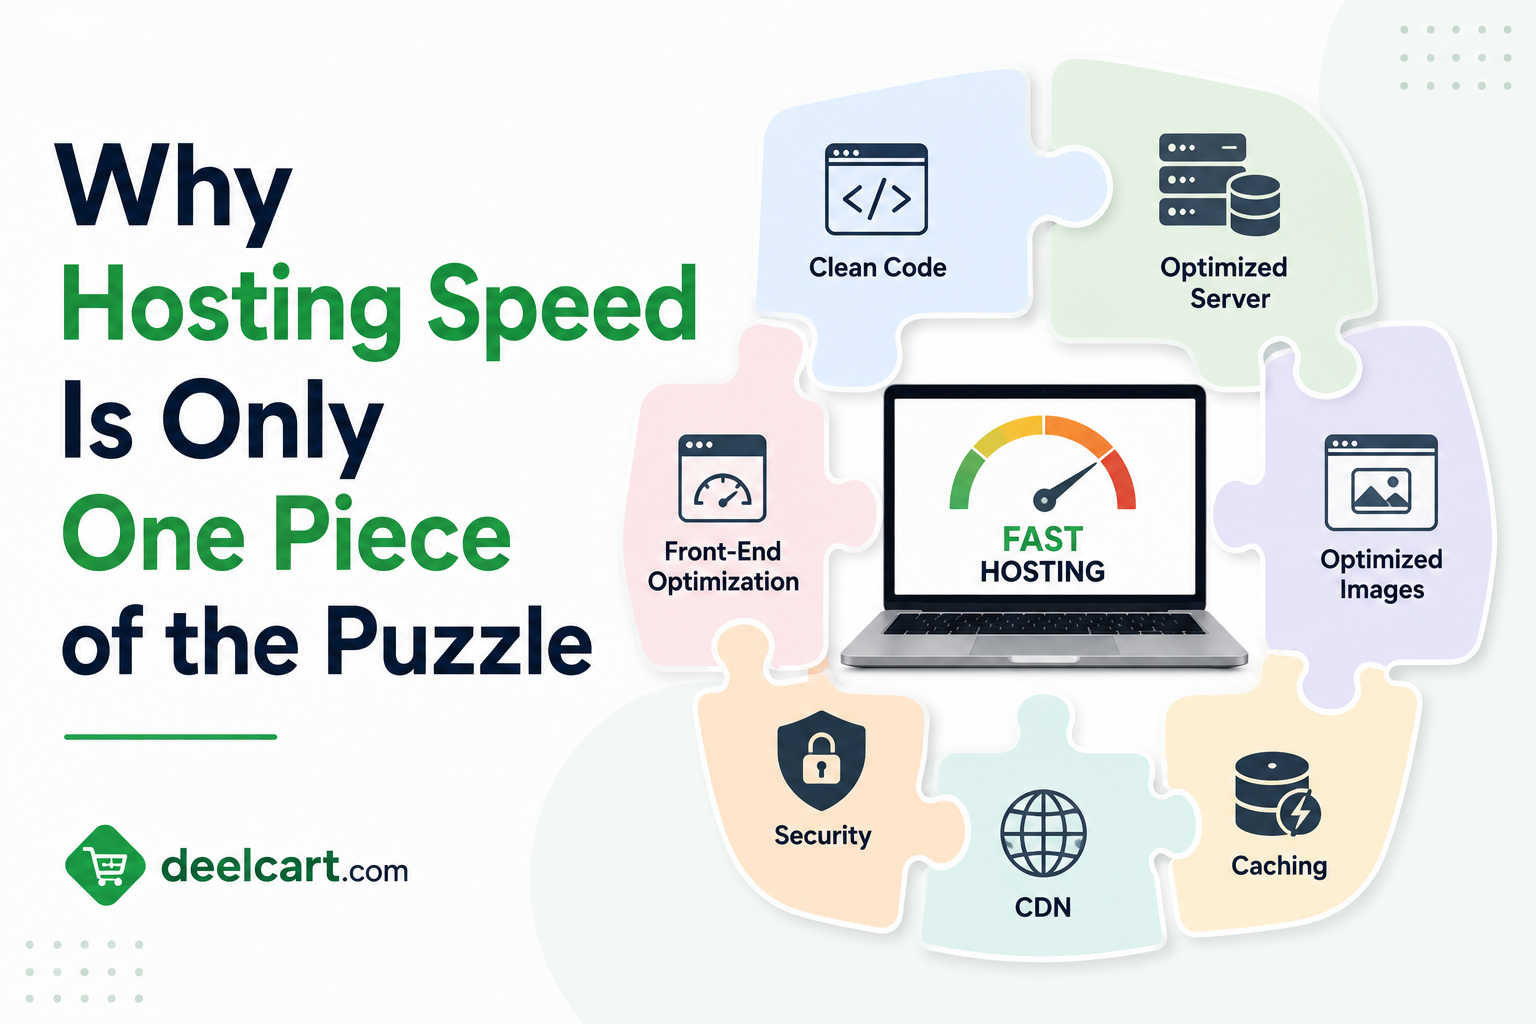
When you pay for fast hosting, you are paying for fast server response time — the time between a browser making a request and the server sending back the first byte of data. This is called Time to First Byte (TTFB) and it is measured in milliseconds.
A fast server might respond in 50 milliseconds. A slow one might take 800 milliseconds. That difference matters — but it is only the beginning of the page load process.
After the first byte arrives, the browser still has to download your HTML, parse it, discover all the CSS and JavaScript files it references, download those, execute the JavaScript, apply the styles, download images, and finally render everything on screen. This entire process can take anywhere from half a second to ten seconds or more — and most of that time has nothing to do with your hosting.
Google measures the user experience of this process through Core Web Vitals — Largest Contentful Paint (LCP), Cumulative Layout Shift (CLS), and Interaction to Next Paint (INP). These scores directly affect your Google search rankings. A fast server with a poorly optimised website will still score badly on Core Web Vitals and rank lower in search results.
Reason 1 — Unoptimised Images
Images are the single most common cause of slow websites in 2026. A typical web page transfers more data through images than through all other resources combined.
The problem is almost always one or more of these:
Images are too large. A 4000 x 3000 pixel photo displayed at 400 x 300 pixels in a sidebar is loading 100 times more data than necessary. The browser downloads the full 4000 x 3000 image and then shrinks it down — all that extra data was wasted.
Images are in the wrong format. JPEG and PNG have been the standard for decades but they are not the most efficient formats available in 2026. WebP is approximately 25 to 35% smaller than JPEG at the same quality. AVIF is smaller still — often 50% smaller than JPEG. Serving WebP or AVIF instead of JPEG or PNG reduces image transfer size dramatically.
Images are not lazy-loaded. When a visitor lands on your page, the browser downloads all images on the page by default — including images far below the fold that the visitor may never scroll to see. Lazy loading delays the download of off-screen images until the visitor scrolls toward them, reducing the amount of data the browser downloads on initial load.
Images are missing explicit dimensions. When an image loads and the browser does not know how large it will be, the page layout shifts to accommodate it. This causes Cumulative Layout Shift — a frustrating user experience where text jumps around as images load.
How to fix it: Compress and resize images before uploading. Serve WebP or AVIF format. Add loading="lazy" to images below the fold. Always set explicit width and height attributes on every image element.
Reason 2 — Too Much JavaScript
JavaScript is the heaviest resource on most modern websites — not in file size necessarily, but in processing cost. Downloading a JavaScript file is only the beginning. The browser then has to parse it, compile it, and execute it — all of which blocks the main thread and delays the page becoming interactive.
The main JavaScript problems are:
Render-blocking scripts. JavaScript loaded in the of your page without async or defer attributes stops the browser from rendering anything until the script is fully downloaded and executed. If you have five scripts loaded this way the browser waits for all five before showing the user a single pixel.
Too many third-party scripts. Analytics tools, chat widgets, advertising scripts, social share buttons, A/B testing platforms, tag managers — each one adds JavaScript that runs on every page load. A site with 15 third-party scripts is common and the combined weight is typically 300 to 500KB of JavaScript that all needs to be downloaded, parsed, and executed before the page is fully interactive.
Unused JavaScript. Most JavaScript bundles include code for features that are not used on every page. A single-page application framework loaded on a simple blog landing page brings megabytes of JavaScript that serve no purpose for that specific page.
Long tasks blocking the main thread. JavaScript runs on the browser's main thread — the same thread that handles user interactions. Long-running JavaScript tasks block user input and cause the page to feel frozen or unresponsive.
How to fix it: Add defer attribute to all non-critical scripts. Audit third-party scripts and remove any that are not essential. Use code splitting to load only the JavaScript needed for the current page. Replace heavy JavaScript frameworks with lighter alternatives where appropriate.
Reason 3 — No Caching
Every time a visitor loads your page, their browser makes requests to your server for HTML, CSS, JavaScript, images, and fonts. Without caching, the browser downloads every resource fresh on every visit — even resources that have not changed since the last visit.
Caching tells the browser to store resources locally and reuse them on subsequent visits without making a network request. A returning visitor whose browser has cached your CSS and JavaScript files loads the page dramatically faster than one who has to download everything again.
Browser caching is controlled by HTTP headers — specifically Cache-Control and Expires. Setting long cache durations on static assets like CSS, JavaScript, and images means returning visitors get those files from their local disk rather than from your server.
Server-side caching stores the output of database queries or rendered pages so the server does not have to regenerate them on every request. WordPress sites without caching regenerate every page from the database on every request — which is slow and unnecessary. A caching plugin stores the generated HTML and serves it directly, bypassing the database entirely.
CDN caching stores your resources on servers around the world. A visitor in Mumbai requesting your site hosted in London gets resources from the nearest CDN node rather than making a transatlantic request for every file.
How to fix it: Configure Cache-Control headers to cache static assets for at least one year. Install a caching plugin if you use a CMS like WordPress. Use a CDN — Cloudflare's free plan is sufficient for most websites.
Reason 4 — No Content Delivery Network
Even with fast hosting, the physical distance between your server and your visitor adds latency. Data travels at the speed of light through fibre optic cables — but it still takes time, and long distances add up.
A server in New York has a round-trip latency of approximately 200 milliseconds to London, 250 milliseconds to Singapore, and 300 milliseconds to Sydney. If your page requires 20 separate requests — HTML, CSS files, JavaScript files, fonts, images — each with that latency, the total wait time is significant even before download time is counted.
A Content Delivery Network (CDN) solves this by storing copies of your static assets on servers distributed globally. A visitor in Singapore gets your images, CSS, and JavaScript from a server in Singapore — not from New York.
CDNs also provide additional benefits — DDoS protection, automatic compression, and HTTPS termination — that improve both performance and security.
How to fix it: Use a CDN. Cloudflare is free and takes 5 minutes to set up for most websites. Point your DNS to Cloudflare and it automatically proxies your traffic through its global network.
Reason 5 — Unoptimised CSS
CSS blocks rendering. The browser will not display any content until it has downloaded and processed all CSS files referenced in the of your page. Every unnecessary byte in your CSS adds to this blocking time.
The main CSS problems are:
Unused CSS. Most websites load CSS frameworks or theme stylesheets that contain thousands of rules. A typical Bootstrap installation includes styles for dozens of components your site never uses. All of that unused CSS still has to be downloaded and parsed on every page load.
Too many CSS files. Each CSS file requires a separate HTTP request. A page that loads eight CSS files makes the browser wait for eight round trips before it can start rendering.
Unminified CSS. CSS files with whitespace, comments, and long property names are larger than they need to be. Minification removes all unnecessary characters, reducing file size by 20 to 40% without affecting functionality.
Render-blocking CSS. CSS that is not needed for the initial viewport — styles for components below the fold or in modals that may never be opened — still blocks rendering if it is all loaded upfront.
How to fix it: Remove unused CSS using tools like PurgeCSS. Combine multiple CSS files into one. Minify CSS in your build process. Load non-critical CSS asynchronously.
Reason 6 — Slow Database Queries
If your website is dynamic — built on WordPress, a custom CMS, or any application that reads from a database — slow database queries can make pages feel slow even when your hosting is fast.
Every page load typically triggers multiple database queries — fetching the page content, the navigation menu, related posts, user data, settings, and more. If any of these queries are slow — because they are scanning large tables without indexes, joining multiple large tables, or running without any query caching — the page cannot be generated until those queries complete.
Common database problems:
- Missing database indexes on frequently queried columns
- N+1 query problems — code that runs one query per item in a list instead of one query for all items
- No query caching — the same expensive query runs on every page load
- Tables that have grown large and are never cleaned up — WordPress options tables are a common culprit
- Plugins that add their own database queries on every page load
Reason 7 — Too Many Plugins or Third-Party Integrations
Every plugin, widget, integration, and third-party service you add to your website has a cost. That cost is paid in JavaScript execution time, additional HTTP requests, additional database queries, and additional server processing on every page load.
A WordPress site with 40 plugins is almost always slower than a site that does the same things with 15 well-chosen plugins. Each plugin adds PHP execution, potential database queries, and often front-end JavaScript and CSS on pages where it serves no purpose.
Third-party integrations are particularly costly because they involve loading resources from external servers — which you have no control over. An external server that is slow, overloaded, or temporarily down can block your page from loading fully.
How to fix it: Audit every plugin and third-party script. Remove anything that is not essential. Load third-party scripts asynchronously so they cannot block your page render. Use a tag manager to centralise script loading and control which scripts load on which pages.
Reason 8 — Missing HTTP/2 or HTTP/3
HTTP/1.1 — the protocol most of the web used for decades — processes requests sequentially. To work around this limitation, web developers had to bundle files together and minimise the number of HTTP requests.
HTTP/2, introduced in 2015, allows multiple requests to be handled simultaneously over a single connection. HTTP/3, now widely supported in 2026, improves on HTTP/2 with faster connection establishment and better performance on unreliable networks.
If your server is still serving pages over HTTP/1.1, you are leaving significant performance improvements on the table. Modern browsers and servers support HTTP/2 and HTTP/3 — but they must both be configured to use them.
How to fix it: Check whether your site uses HTTP/2 by looking at the Protocol column in your browser's DevTools Network tab. If it shows h1 instead of h2 or h3, contact your hosting provider or configure your web server to enable HTTP/2. Using Cloudflare automatically upgrades connections to HTTP/2 and HTTP/3.
Reason 9 — No Text Compression
Text-based resources — HTML, CSS, JavaScript, JSON, XML — can be compressed significantly before being sent from the server to the browser. The browser decompresses them almost instantly on arrival.
Gzip compression typically reduces text file sizes by 60 to 80%. Brotli — a newer compression algorithm supported by all modern browsers — achieves even better compression, typically 15 to 25% smaller than Gzip for the same files.
Many hosting configurations do not enable compression by default. A web server sending uncompressed JavaScript and CSS files is transferring two to four times more data than necessary on every request.
How to fix it: Check whether your server is using compression by looking at the Content-Encoding response header in your browser's DevTools. If it shows gzip or br compression is active. If it is missing, enable Gzip or Brotli compression in your web server configuration or use Cloudflare which applies Brotli compression automatically.
Reason 10 — Web Fonts Loaded Inefficiently
Custom web fonts make websites look polished but they are a common source of performance problems. Fonts are typically loaded after the browser has parsed your CSS — which means the browser knows it needs a font but has to wait for the CSS to load before it can even start downloading the font.
The main font problems are:
Flash of Invisible Text (FOIT). The browser hides all text until the custom font is downloaded, leaving the page showing blank spaces where words should be.
Flash of Unstyled Text (FOUT). The browser shows system font text that then swaps to the custom font when it arrives, causing a visual shift.
Too many font weights and styles. Loading eight variants of a font family — regular, italic, bold, bold italic, light, light italic, medium, medium italic — when you only use three or four wastes bandwidth.
Loading fonts from Google Fonts without optimisation. The default Google Fonts embed code adds DNS lookup time and connection time to an external domain on every page load.
How to fix it: Self-host your fonts to eliminate the external domain connection. Use font-display: swap to show system font text while the custom font loads — eliminating FOIT. Preload your most important font files using in your HTML head. Load only the font weights you actually use.
How to Diagnose Your Website's Speed Problems
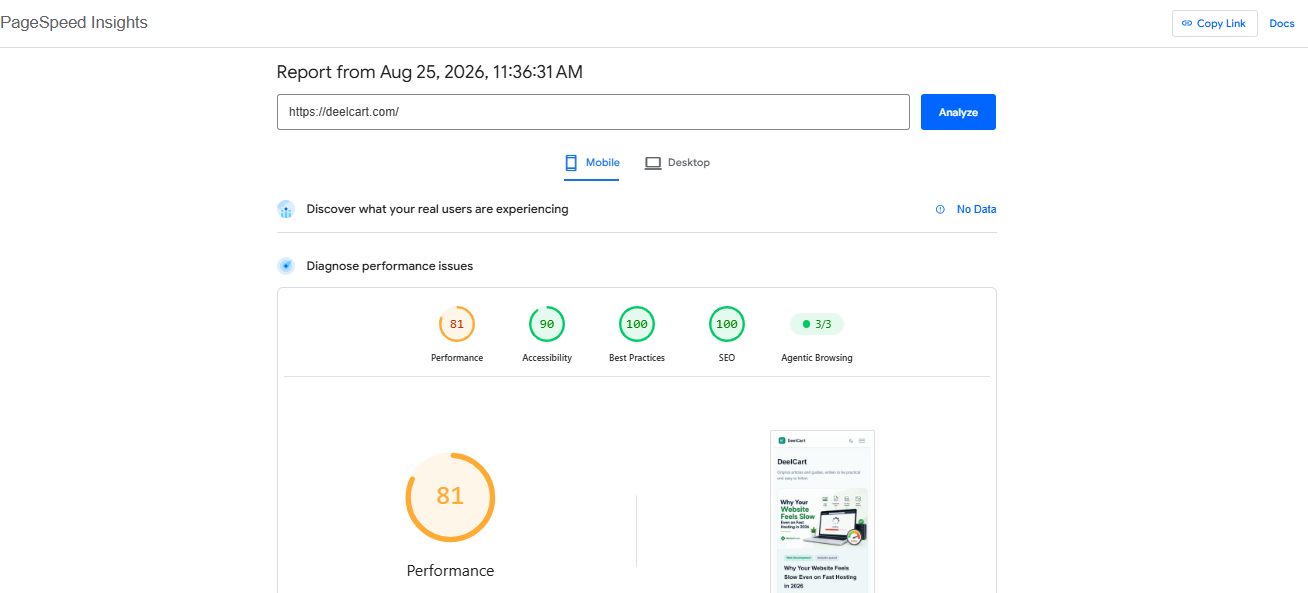
Before fixing anything, measure what is actually slow. The main tools for this are:
Google PageSpeed Insights — analyses your page and gives specific recommendations with impact ratings. Available free at pagespeed.web.dev. Shows both mobile and desktop scores.
WebPageTest — more detailed waterfall charts showing exactly what loads in what order and what is blocking what. Available free at webpagetest.org.
Chrome DevTools Network Tab — open in your browser by pressing F12, click Network, and reload your page. Shows every resource loaded, its size, how long it took, and what protocol was used.
Lighthouse — built into Chrome DevTools. Runs a performance audit and gives specific actionable recommendations with estimated time savings for each fix.
Start with Google PageSpeed Insights — it gives you a prioritised list of the most impactful fixes for your specific page. Work through the recommendations from highest impact to lowest.
Priority Order for Fixes
If you need to prioritise which fixes to tackle first, follow this order:
Highest impact:
- Optimise and compress images — almost always the largest single gain
- Remove unused JavaScript and CSS — reduces parse and execution time
- Enable a CDN — reduces latency for all global visitors
- Enable caching — dramatically improves returning visitor experience
- Fix render-blocking resources — improves time to first render
- Enable text compression — reduces transfer size of all text resources
- Optimise web fonts — eliminates text rendering delays
- Audit and remove unnecessary plugins
- Enable HTTP/2 or HTTP/3
- Optimise database queries
- Clean up accumulated database bloat
Frequently Asked Questions
Why is my website slow despite good hosting?
Fast hosting only improves server response time — the time before your website starts sending data. After that your page speed depends on the size and number of resources that need to be downloaded, how much JavaScript needs to be executed, whether caching is in place, and how far your server is from your visitors. All of these are independent of hosting speed.
What is a good page load time in 2026?
Google's Core Web Vitals targets Largest Contentful Paint under 2.5 seconds for a good score. For user experience, pages that load visible content in under one second feel fast. Pages that take more than three seconds to show content have significantly higher bounce rates.
Does switching to a faster host fix a slow website?
Sometimes — if slow server response time (TTFB above 600ms) is the primary problem. But in most cases hosting is not the bottleneck. Run a test with Google PageSpeed Insights or WebPageTest before switching hosting. If the Opportunities section lists image, JavaScript, and CSS issues rather than server response time, switching hosts will not help much.
Is Cloudflare enough to speed up my website?
Cloudflare significantly helps with CDN delivery, caching, and compression. But it cannot fix problems baked into your HTML — heavy JavaScript frameworks, unoptimised images, or too many third-party scripts still load slowly even through Cloudflare. Use Cloudflare as part of a broader optimisation effort, not as a complete solution.
How do I fix my Core Web Vitals score?
Each Core Web Vital has different fixes. For Largest Contentful Paint — optimise your hero image, preload critical resources, and reduce server response time. For Cumulative Layout Shift — add explicit dimensions to images and avoid inserting content above existing content. For Interaction to Next Paint — reduce JavaScript execution time and avoid long tasks on the main thread.
Do website speed issues affect SEO?
Yes. Google uses Core Web Vitals as a ranking signal. Slow pages with poor LCP, high CLS, and poor INP scores rank lower than fast pages with equivalent content quality. Page speed also indirectly affects SEO through bounce rate — visitors who leave before a page loads fully send negative engagement signals.
Justin is a self-taught developer who builds and runs DeelCart himself — from the articles to the server it runs on. He manages his own Linux infrastructure and writes guides based on tools and workflows he actually uses day to day.