Common Reasons a Website Fails Core Web Vitals (and Simple Fixes)
Since Google made Core Web Vitals a ranking signal, poor scores directly affect your search visibility. A page that fails Core Web Vitals ranks lower than a comparable page that passes — all other things being equal.
The frustrating part is that most Core Web Vitals failures come from a small set of recurring problems. The fixes are not complicated — but you have to know what to look for first.
This guide covers the most common reasons websites fail each Core Web Vital and the exact fixes for each one.
How to Check Your Core Web Vitals Scores
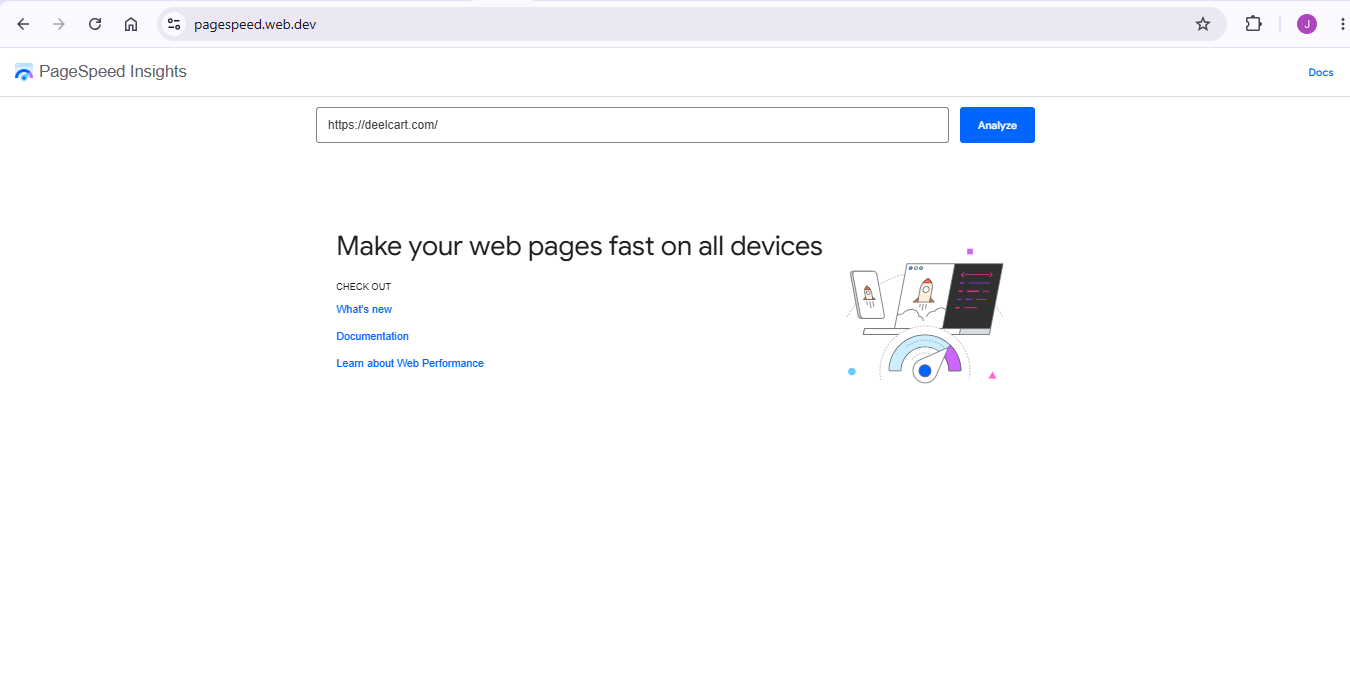
Before fixing anything, measure what you are actually failing. The main tools are:
Google PageSpeed Insights — visit pagespeed.web.dev and enter your URL. It shows your scores for both mobile and desktop, labels each metric as Good, Needs Improvement, or Poor, and gives specific recommendations. Always check mobile — Google uses mobile-first indexing and mobile scores are typically significantly worse.
Google Search Console — the Core Web Vitals report in Search Console shows field data from real users visiting your site over 28 days. This is more representative than lab data because it reflects actual user conditions including slow devices and slower network connections.
Chrome DevTools Lighthouse — press F12 in Chrome, click the Lighthouse tab, and run a performance audit. Provides detailed diagnostics for each metric with specific elements identified as causing problems.
WebPageTest — webpagetest.org provides detailed waterfall charts, filmstrip view of page loading, and per-metric diagnostics. More detailed than PageSpeed Insights for identifying exactly what is causing a specific metric to fail.
Check PageSpeed Insights first — it is the fastest way to identify which metrics are failing and which specific elements are causing the problem.
Largest Contentful Paint (LCP)
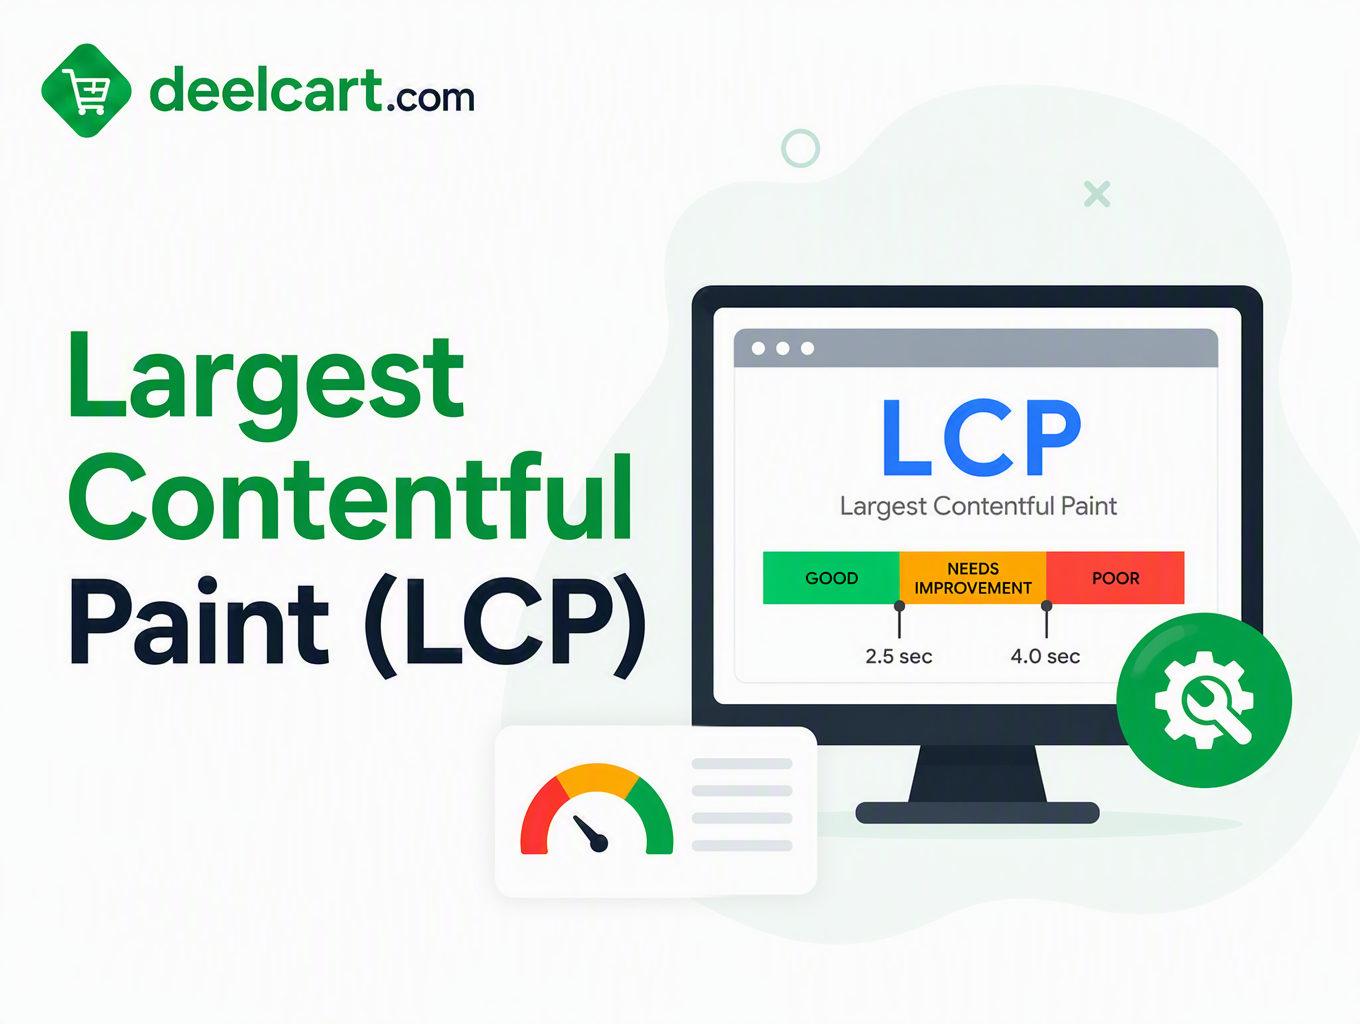
LCP measures how long it takes for the largest visible content element on the page to finish loading. This is typically the hero image, a large heading, or a banner. Google's threshold is under 2.5 seconds for a Good score.
LCP is the most commonly failed Core Web Vital and the one with the largest impact on perceived page speed — it is the moment the user feels the page has arrived.
Reason 1 — Slow Server Response Time
If your server takes longer than 600 milliseconds to respond to the initial request, LCP will almost certainly fail regardless of everything else. The LCP element cannot start loading until the browser receives the HTML — and if the HTML is slow, everything downstream is delayed.
What causes it: Shared hosting with slow response times, no caching on dynamic pages, slow database queries generating the page, or no CDN routing users to the nearest server.
How to fix it: Check your Time to First Byte using WebPageTest — it shows exactly how long the server takes to respond. If TTFB is over 600ms, the priorities are enabling full-page caching for dynamic sites, adding a CDN like Cloudflare to route users to the nearest point of presence, and optimising the slowest database queries generating your pages.
Reason 2 — Unoptimised Hero Image
The hero image — the large image at the top of most pages — is the LCP element on the majority of websites. If it is large, in the wrong format, or not preloaded, it will fail LCP.
What causes it: Hero images uploaded at full camera resolution — 3000 pixels wide, 3 to 5MB — that are displayed at 1200 pixels wide. Images served in JPEG or PNG when WebP or AVIF would be significantly smaller. Images not preloaded so the browser only discovers them after parsing CSS.
How to fix it:
Resize the hero image to the maximum display size — typically 1200 to 1600 pixels wide for desktop. Compress it aggressively — aim for under 200KB for a full-width hero image. Convert to WebP format — WebP is typically 25 to 35% smaller than JPEG at equivalent quality.
Add a preload hint in the HTML for your hero image. This tells the browser to start downloading the image as early as possible rather than waiting until it parses the CSS and discovers it. A tag for the hero image is one of the highest-impact LCP fixes available.
If your hero image is responsive — different sizes for mobile and desktop — use the imagesrcset attribute on the preload tag to preload the correct size for the current viewport.
Reason 3 — Hero Image Not Prioritised
By default browsers treat all images with equal priority. The hero image — which directly controls LCP — deserves higher priority than decorative images below the fold.
What causes it: Missing fetchpriority="high" attribute on the hero image, or loading="lazy" applied to the hero image by mistake.
How to fix it: Add fetchpriority="high" to your hero image element. This signals to the browser that this image is more important than others and should be downloaded sooner. Never apply loading="lazy" to the hero image — lazy loading delays the image until the element is about to enter the viewport, which defeats the purpose for the first visible image.
Reason 4 — Render-Blocking Resources
CSS and JavaScript in the without proper attributes block rendering. The browser cannot display anything — including the LCP element — until it has downloaded and processed all render-blocking resources.
What causes it: Multiple CSS files loaded in the , JavaScript files loaded without async or defer attributes, large font files that block text rendering.
How to fix it: Add defer to all non-critical JavaScript in the . Combine multiple CSS files into one request. Load non-critical CSS asynchronously. Preconnect to external domains that host critical resources — Google Fonts, CDNs — using to reduce DNS lookup and connection time for resources needed early.
Reason 5 — Client-Side Rendered Content as the LCP Element
Single-page applications that render content via JavaScript have a fundamental LCP problem — the HTML delivered by the server is a mostly empty shell, and content only appears after JavaScript downloads, parses, and executes. The LCP element may not appear until several seconds after the initial page load.
What causes it: React, Vue, or Angular applications without server-side rendering, where the hero image or main heading is inserted by JavaScript after the page loads.
How to fix it: Implement server-side rendering (SSR) or static site generation (SSG) for pages where LCP performance matters. Next.js, Nuxt, and Astro all support SSR and SSG — the HTML delivered to the browser contains the full content including the LCP element, which can start loading immediately rather than waiting for JavaScript execution.
Cumulative Layout Shift (CLS)
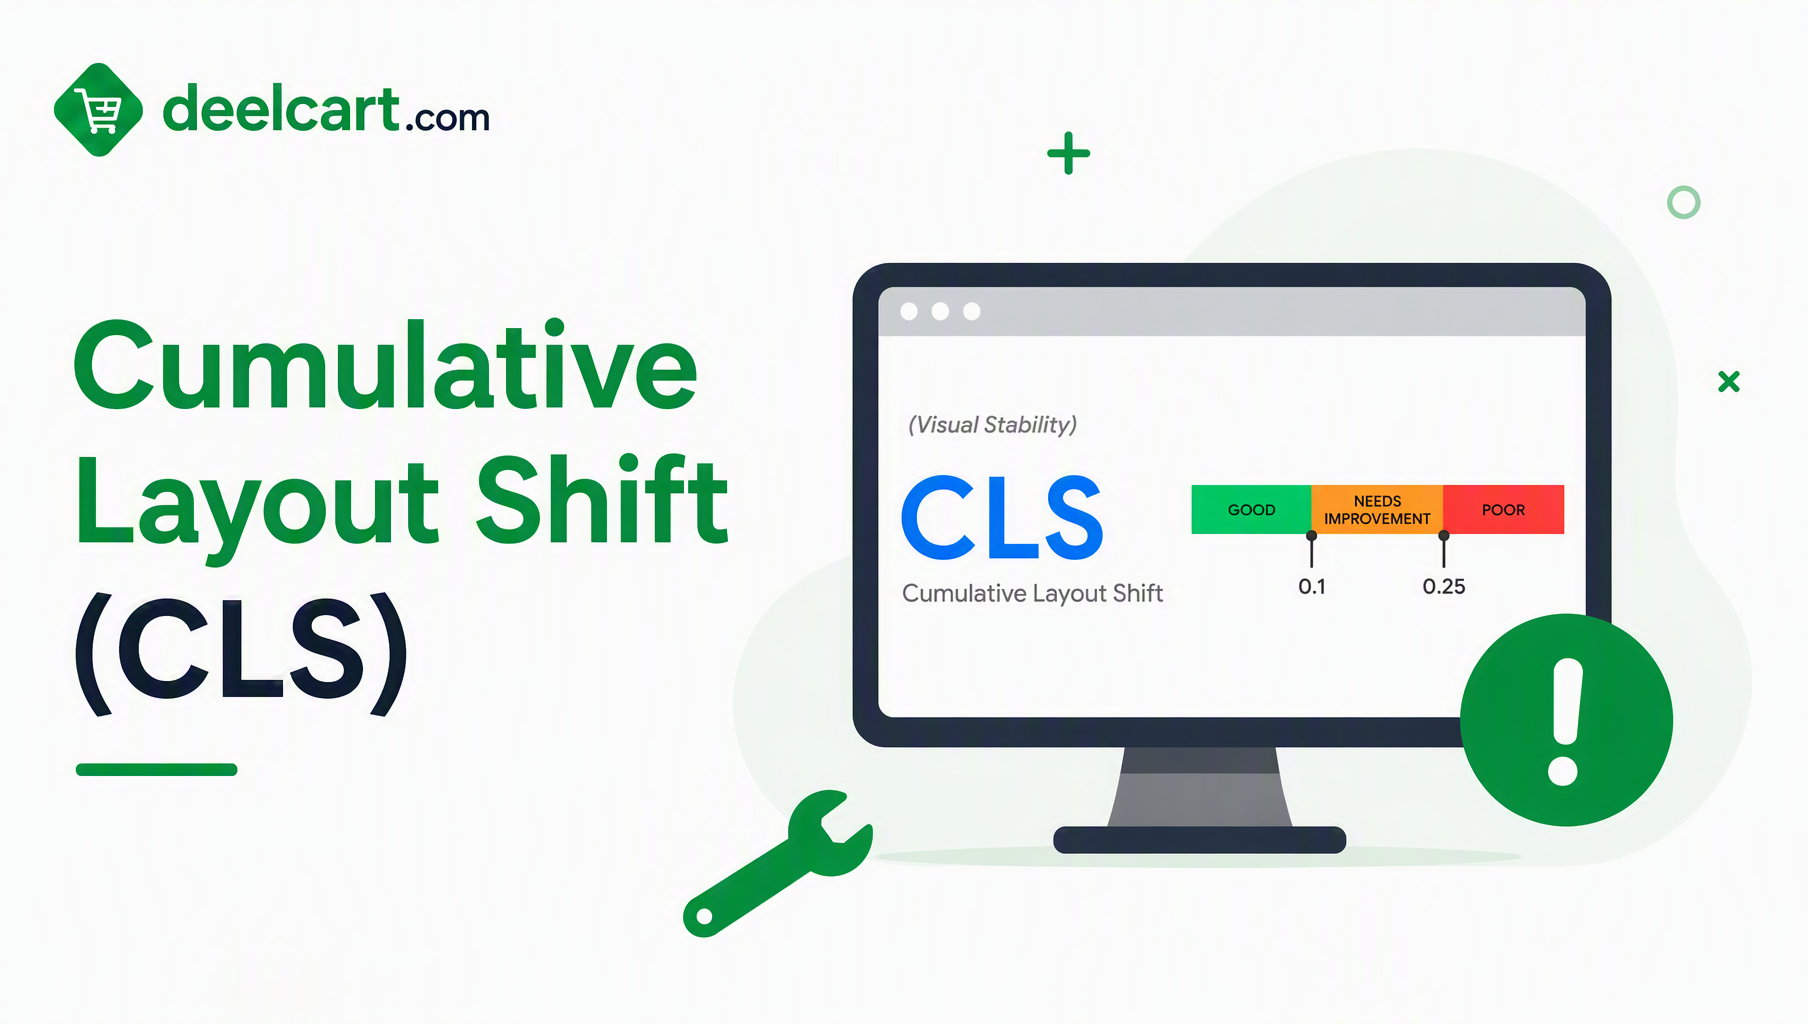
CLS measures visual stability — how much the page layout shifts while loading. Every time content moves unexpectedly — because an image loaded and pushed text down, or an ad appeared and shifted the content — CLS increases. Google's threshold is under 0.1 for a Good score.
Layout shift is one of the most frustrating user experiences on the web — you are about to click a button and it moves just as you click, sending you to the wrong destination.
Reason 6 — Images Without Explicit Dimensions
The most common cause of layout shift is images loaded without width and height attributes. When an image loads, the browser does not know how large it will be. It displays nothing, then when the image arrives it inserts it into the layout — pushing everything below it down.
What causes it: HTML image tags with no width and height attributes: <img src="photo.jpg" alt="Photo">. The browser has no reserved space for the image before it downloads.
How to fix it: Add explicit width and height attributes to every image: <img src="photo.jpg" width="800" height="600" alt="Photo">. The browser uses these dimensions to reserve the correct space in the layout before the image downloads — no shift occurs when it arrives.
For responsive images that scale with CSS, still include the width and height attributes with the intrinsic dimensions. Modern browsers use these to calculate the correct aspect ratio even when the displayed size is different.
Reason 7 — Ads, Embeds, and Iframes Without Reserved Space
Ads served by third-party networks, embedded content like YouTube videos, and iframes all cause layout shift when they load if no space is reserved for them before they arrive.
What causes it: Ad slots with no reserved height, YouTube embeds inserted by JavaScript, social media embeds that expand to their full size when the script loads.
How to fix it: Reserve space for ad slots with a container of fixed dimensions — the standard ad sizes are known in advance. Wrap YouTube embeds and other iframes in a container with the correct aspect ratio using the padding-top trick or the CSS aspect-ratio property. This ensures the space is reserved in the layout before the content loads.
For ad networks where the size may vary, use the minimum expected size as the reserved height. A slight expansion is a smaller CLS contribution than no reservation at all.
Reason 8 — Web Fonts Causing Text Swap
When custom web fonts are used, browsers often show a flash of invisible text or flash of unstyled text while the font downloads. When the font arrives, text reflows — changes size, spacing, or position — which contributes to CLS.
What causes it: Web fonts loaded without font-display configured, or with font-display: block which hides text until the font downloads. The reflow from system font to custom font causes layout shift.
How to fix it: Use font-display: optional for fonts where the swap is visually significant, or font-display: swap to show text immediately in a system font and switch when the custom font arrives. Preload your most important font files using to minimise the time between page load and font availability. Self-hosting fonts eliminates the external domain connection latency.
The most CLS-efficient approach is choosing a custom font whose metrics — character width, line height — closely match a common system font, minimising the reflow when the swap occurs.
Reason 9 — Content Injected Above Existing Content
JavaScript that inserts banners, cookie consent notices, chat widgets, promotional bars, or newsletter popups at the top of the page after the initial render pushes all existing content down — creating large layout shifts.
What causes it: Cookie banners inserted by JavaScript after page load, sticky promotional headers added dynamically, chat widgets that push content when they initialise.
How to fix it: Reserve space for elements that will appear above the content — include a placeholder in the initial HTML with the same dimensions as the element that will be inserted. For cookie consent banners, overlay them on the content rather than inserting them in the document flow. Use CSS transforms for animations that would otherwise cause layout shift — transforms do not affect document flow.
Reason 10 — Animations That Shift Layout
CSS animations that change properties affecting document layout — width, height, margin, padding, top, left — cause layout shift. This includes expanding accordions, sliding panels, and any animation that changes an element's size or position in the document flow.
What causes it: Animating height from 0 to auto for accordion content, slide-in panels that push content rather than overlaying it, expanding navigation menus.
How to fix it: Animate using CSS transform and opacity rather than layout properties. transform: translateX() moves an element without affecting document flow — no layout shift occurs. opacity fades elements in and out without shifting anything. These properties are also GPU-accelerated, making animations smoother as well as CLS-friendly.
Interaction to Next Paint (INP)
INP replaced First Input Delay (FID) as a Core Web Vital in 2024. It measures the time from any user interaction — click, tap, keyboard press — to when the browser paints the next frame in response. Google's threshold is under 200 milliseconds for a Good score.
INP failures make pages feel sluggish and unresponsive — the user clicks something and nothing appears to happen for a noticeable moment. This is almost always a JavaScript problem.
Reason 11 — Long Tasks Blocking the Main Thread
The browser's main thread handles both JavaScript execution and rendering. When JavaScript runs a task that takes more than 50 milliseconds, it blocks rendering — any input event during that task cannot be processed until the task completes. The user experiences this as the page being unresponsive.
What causes it: Heavy JavaScript initialization running when the page loads, synchronous data processing in response to user events, third-party scripts running expensive operations on the main thread.
How to fix it: Use the Chrome DevTools Performance panel to identify long tasks — they appear as red bars in the main thread timeline. Break long tasks into smaller chunks using setTimeout with a 0 delay or the scheduler.postTask() API to yield control to the browser between chunks. Move heavy computation off the main thread using Web Workers.
For third-party scripts that create long tasks — analytics, chat widgets, ad scripts — load them asynchronously and defer their initialization until after the page is interactive.
Reason 12 — Excessive JavaScript Bundle Size
Large JavaScript bundles take longer to download, parse, and compile — all of which happens on the main thread and delays interactivity. A 2MB JavaScript bundle might take several seconds to parse and compile on a mid-range mobile device even after it has finished downloading.
What causes it: Entire JavaScript frameworks loaded on every page regardless of which features are used, no code splitting so all application code is loaded upfront, unused dependencies included in the bundle.
How to fix it: Implement code splitting — loading only the JavaScript needed for the current page rather than the entire application. Modern bundlers like Webpack, Vite, and Rollup support route-based code splitting that loads additional code lazily as users navigate.
Audit your dependencies with a tool like Bundle Analyzer or Bundlephobia. Replace heavy libraries with lighter alternatives — moment.js with date-fns, lodash with native JavaScript methods — where the full library is not needed.
Remove unused code using tree shaking — ensure your bundler is configured to eliminate exports that are never imported.
Reason 13 — Slow Event Handlers
Event handlers that take a long time to execute — because they do expensive synchronous work in response to a click — create poor INP even when the main thread is otherwise clear.
What causes it: Click handlers that perform synchronous DOM manipulation across many elements, event handlers that trigger expensive recalculations, handlers that make synchronous operations before updating the UI.
How to fix it: Defer non-essential work in event handlers using setTimeout or requestAnimationFrame. Provide immediate visual feedback — show a loading state — before performing the expensive work. This tells the user their input was received immediately while the processing happens in the background.
Avoid forcing synchronous layout recalculation — reading layout properties like offsetWidth or getBoundingClientRect inside an event handler immediately after modifying the DOM forces the browser to recalculate layout synchronously, which is expensive.
Reason 14 — Too Many Event Listeners
Attaching event listeners to every element in a large list — a table with 500 rows, each with its own click handler — creates performance overhead when any interaction occurs.
What causes it: Direct event listener attachment to individual elements in large lists, event listeners added in loops, frameworks that attach listeners per-element by default.
How to fix it: Use event delegation — attach a single event listener to the parent container and determine which child was clicked using event.target. This replaces hundreds of event listeners with one, reducing memory usage and event processing overhead.
Reason 15 — Input Delay from Third-Party Scripts
Third-party scripts — advertising networks, analytics tools, social media widgets, chat systems — run JavaScript on your page. If those scripts have long tasks or run during user interactions, they contribute to poor INP even though they are not your code.
What causes it: Tag manager containers loading many third-party scripts that all initialise on page load, advertising scripts that run expensive operations continuously, chat widgets that process every keypress.
How to fix it: Audit third-party scripts using the Chrome DevTools Performance panel — identify which scripts are creating long tasks. Load non-essential third-party scripts with async and defer their initialisation with setTimeout to after the page is interactive. Remove scripts that do not justify their performance cost. Use a tag manager to control when each script initialises — delaying advertising scripts until after user interaction often reduces INP significantly.
Quick Reference — Most Impactful Fixes by Metric
| Metric | Highest Impact Fix | Second Priority |
|---|---|---|
| LCP | Optimise and preload hero image | Reduce server response time with caching and CDN |
| CLS | Add width and height to all images | Reserve space for ads, embeds, and dynamic content |
| INP | Break up long JavaScript tasks | Reduce and defer third-party scripts |
Priority Order for Fixing Core Web Vitals
If you are failing multiple metrics, fix them in this order.
Fix LCP first. It has the most direct impact on perceived page speed and the most significant relationship to bounce rate and conversion. Users who leave before LCP completes never interact with anything else on the page.
Fix CLS second. Layout shift is the most noticeable quality problem for users — it is the shift that causes misclicks and creates distrust. It is also usually the easiest to fix once you identify the specific elements causing the shift.
Fix INP third. INP failures affect interactive pages more than content pages. If your site is primarily content with limited interactivity, INP may already be passing. Focus on it after LCP and CLS are resolved.
Frequently Asked Questions
How long does it take to see Core Web Vitals improvements in Google Search Console?
Search Console shows 28-day rolling field data — real user measurements collected over the past month. Changes you make today will take up to 28 days to be fully reflected in Search Console data. PageSpeed Insights lab data reflects changes immediately — use it to verify fixes work before waiting for field data to update.
My PageSpeed Insights score is good but Search Console shows failing Core Web Vitals. Why?
PageSpeed Insights lab data simulates a page load under controlled conditions. Search Console field data reflects real users on real devices and connections — including slow mobile connections and older devices. Field data is almost always worse than lab data because real conditions are more varied than lab conditions. Focus on fixing the specific elements identified in the field data report.
Does improving Core Web Vitals directly improve Google rankings?
Core Web Vitals are a ranking signal but not the dominant one. Content quality, relevance, and backlinks remain far more important. However, for pages competing closely on content quality, Core Web Vitals can be the differentiating factor. Additionally improved Core Web Vitals typically improve user experience directly — lower bounce rates and higher engagement — which has secondary positive effects on rankings.
How do I fix Core Web Vitals on WordPress?
WordPress-specific fixes include installing a caching plugin — WP Rocket, W3 Total Cache, or LiteSpeed Cache — to reduce TTFB. Using an image optimisation plugin — ShortPixel, Imagify, or WebP Express — to automatically convert images to WebP and add lazy loading. Using Cloudflare for CDN and compression. Reducing the number of plugins to reduce JavaScript and CSS overhead. Avoiding page builders that add excessive CSS and JavaScript to every page.
Can a high CLS score be caused by fonts?
Yes. Web font loading causes text to reflow when the custom font replaces the fallback system font — this reflow contributes to CLS. The fix is using font-display: swap or font-display: optional, preloading critical fonts, self-hosting fonts to reduce load time, and using the CSS size-adjust descriptor to reduce the size difference between the custom font and its fallback.
What is a good target for each Core Web Vital?
Google's Good thresholds are LCP under 2.5 seconds, CLS under 0.1, and INP under 200 milliseconds. Aim for well within these thresholds rather than just passing — the Good range for LCP is anything under 2.5 seconds, but targeting under 1.5 seconds provides margin for real-world variation and slower devices.
Justin is a self-taught developer who builds and runs DeelCart himself — from the articles to the server it runs on. He manages his own Linux infrastructure and writes guides based on tools and workflows he actually uses day to day.