Handling Dynamic Element Hydration and Network Latency Flakiness in E2E Automation Testing
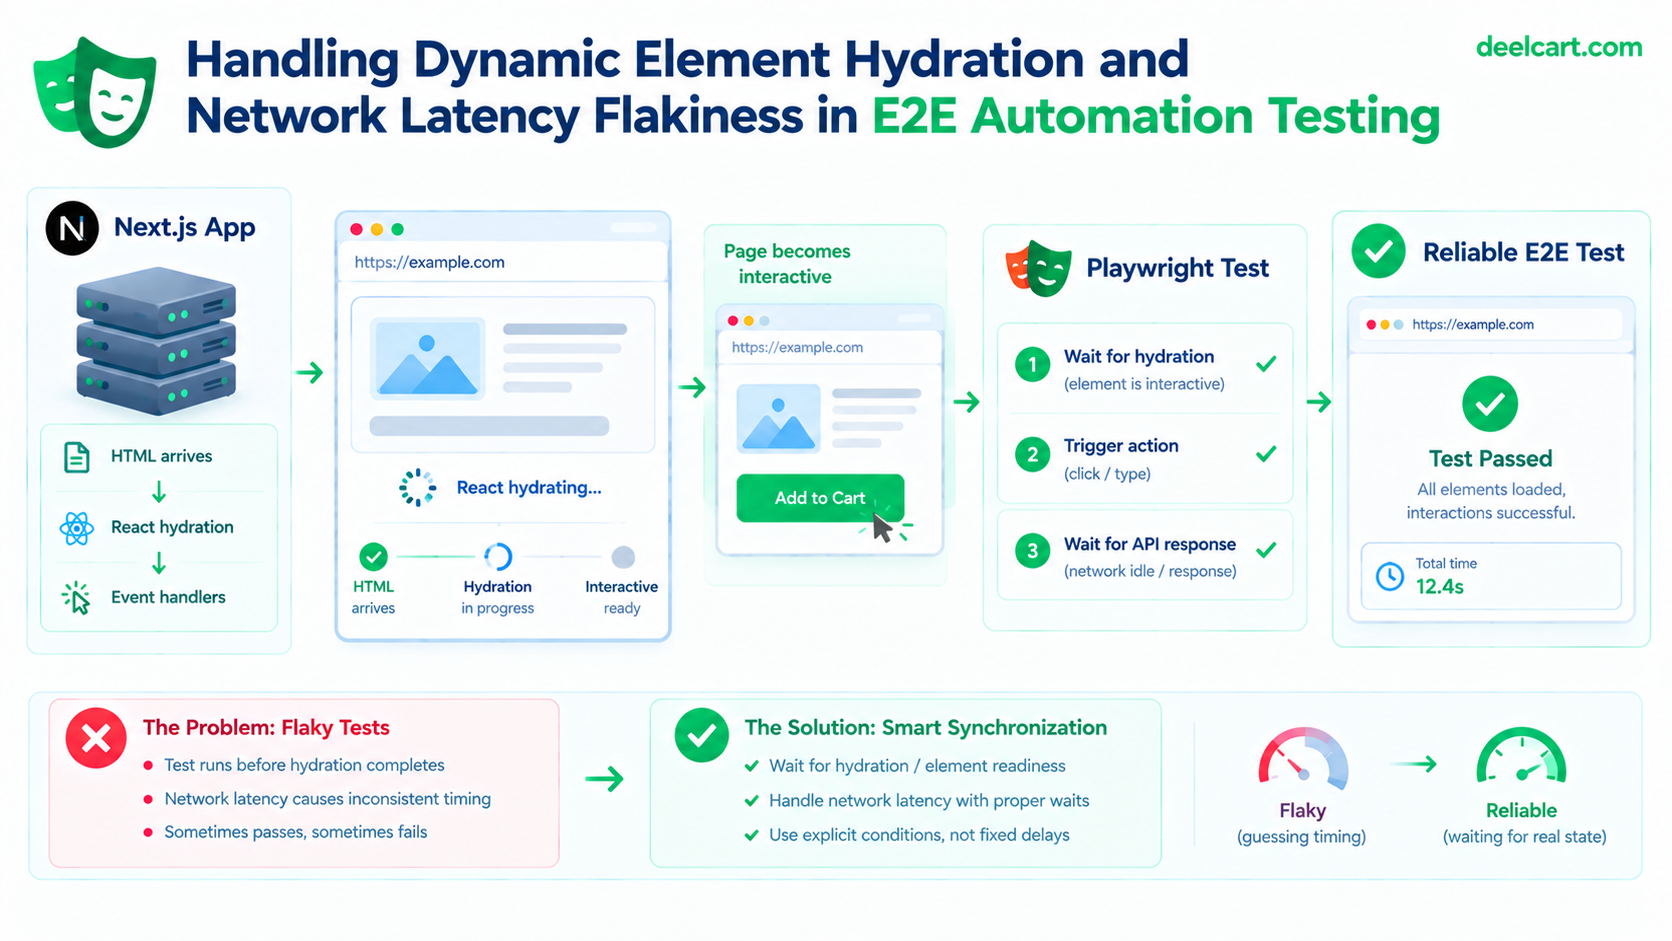
I already fixed the basic version of this with a hydration marker. Then it broke again, in a way that was harder to see: the marker said the page was ready, one button worked, and another button on the same page silently did nothing. This article is about that second problem, which shows up as soon as a page streams slow content. If you only need the basics, my other piece on hydration and network latency flakiness covers them.
The Basics: Clicking Before Hydration Finishes
A server-rendered React page arrives as complete HTML. The button is visible, it looks ready, and a test can find it instantly. But the button may not be interactive yet, because React hasn't attached its event handlers. That step is called hydration, and it happens after the JavaScript bundle downloads and executes.
What happens when a test clicks in that gap varies. React can queue and replay some discrete events once the target hydrates, but that behavior depends on the React version, which boundary the element is in, and the event type. Other times the click lands on plain HTML, and default browser behavior takes over: a form can fall back to a full-page native submit instead of your handler. You shouldn't build a test suite on any of those outcomes. The failures look different each time, and on a fast local machine the gap is so short it almost never bites, while a slow CI runner can hit it one run in ten.
The tempting fix is a fixed pause:
await page.goto('/signup');
await page.waitForTimeout(2000); // hope hydration is done by now
await page.click('#submit');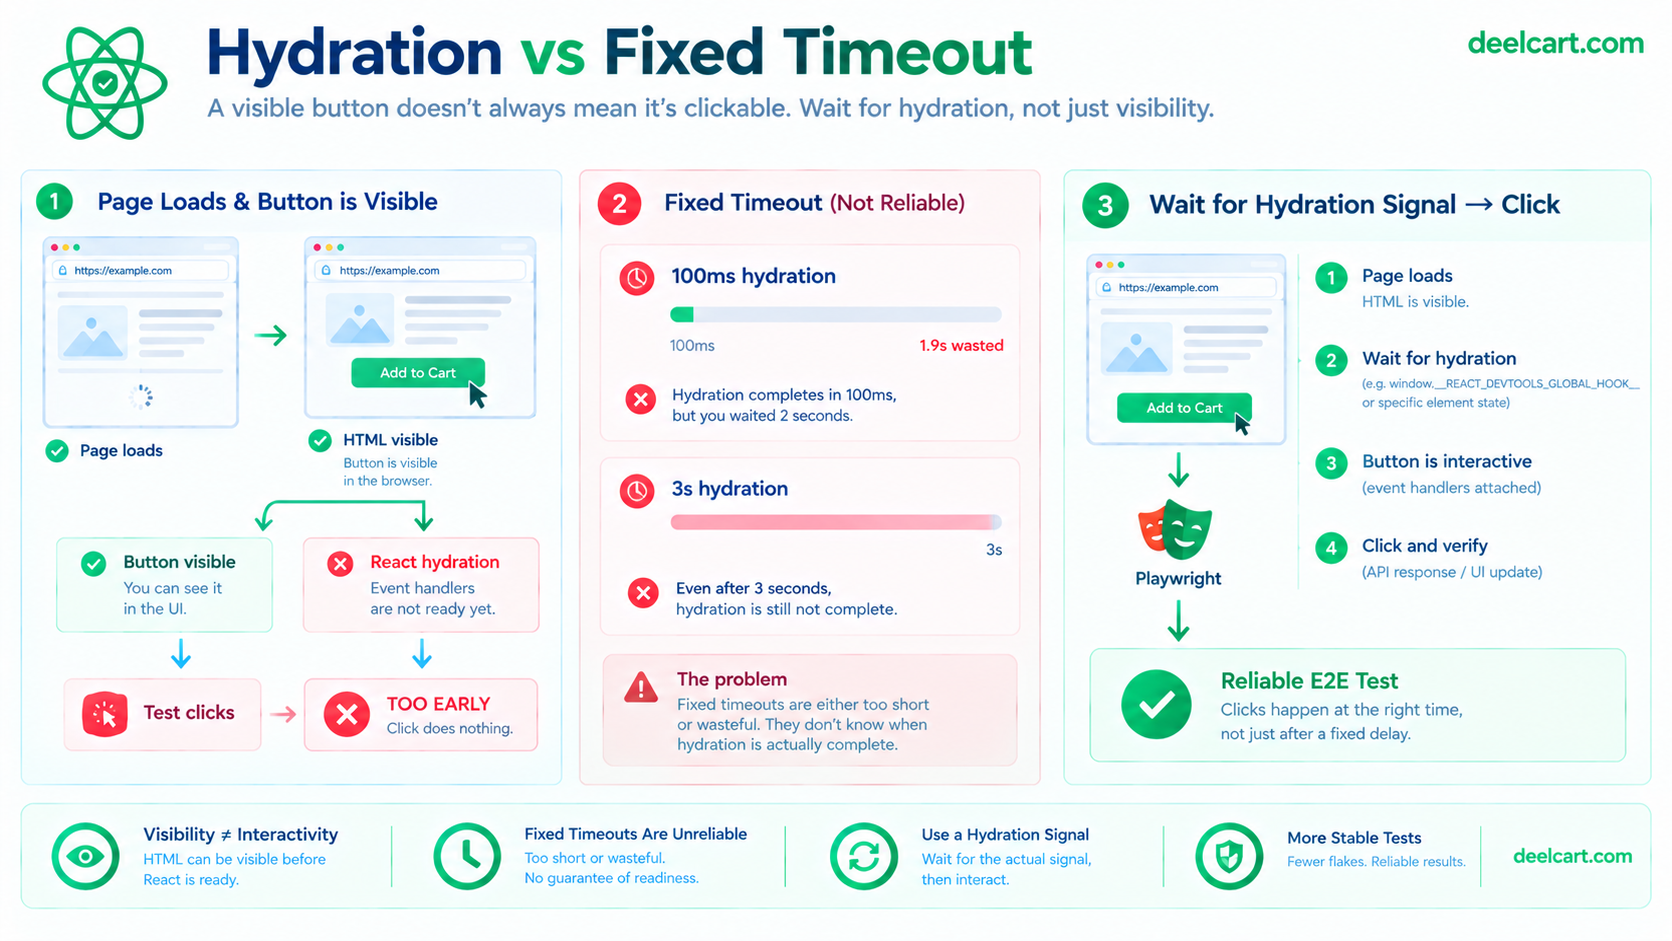
This is wrong in both directions. Too short and the flake comes back on a slow runner. Too long and every test in the suite pays that cost even when the page was ready in 100 milliseconds.
The First Fix: A Hydration Marker
The reliable fix is to have the app announce when it has hydrated, then make the test wait for that announcement. A tiny client component sets a marker once React is running:
'use client';
import { useEffect } from 'react';

export default function HydrationMarker() {
  useEffect(() => {
    document.body.dataset.hydrated = 'true';
  }, []);
  return null;
}
Render it once in the root layout. An effect only runs on the client after the component has hydrated, so the attribute appearing is proof that this part of the page is live. The test waits for it:
import { test, expect } from '@playwright/test';

test('signup form submits', async ({ page }) => {
  await page.goto('/signup');
  await page.locator('body[data-hydrated="true"]').waitFor();

  await page.getByLabel('Email').fill('[email protected]');
  await page.getByRole('button', { name: 'Sign up' }).click();

  await expect(page.getByText('Check your inbox')).toBeVisible();
});
This worked for a long time. Then I added a dashboard page with a slow section, and it stopped being enough.
Where One Global Marker Fails: Streaming
Next.js can stream a page. The fast parts of the HTML arrive first, and anything wrapped in a Suspense boundary shows a fallback until its data is ready, then streams in later. React hydrates each boundary separately, which is a good thing for users and a trap for tests.
Here's a page that reproduces it. The stats panel depends on a slow query, simulated here with a 3-second delay:
// app/dashboard/page.tsx
import { Suspense } from 'react';
import StatsPanel from '@/components/StatsPanel'; // client component with a "Refresh" button

async function SlowStats() {
  await new Promise((resolve) => setTimeout(resolve, 3000)); // simulates a slow database query
  return <StatsPanel />;
}

export default function DashboardPage() {
  return (
    <main>
      <h1>Dashboard</h1>
      <button id="export">Export</button>
      <Suspense fallback={<p>Loading stats…</p>}>
        <SlowStats />
      </Suspense>
    </main>
  );
}
The marker in the root layout sits outside the Suspense boundary, so it fires as soon as the shell hydrates. At that moment the Export button is live, but the "Refresh" button inside the stats panel doesn't exist yet, or exists as unhydrated HTML. A test that waits for data-hydrated and then clicks Refresh is back to the original race, and it passes or fails depending on how long the query took that run.
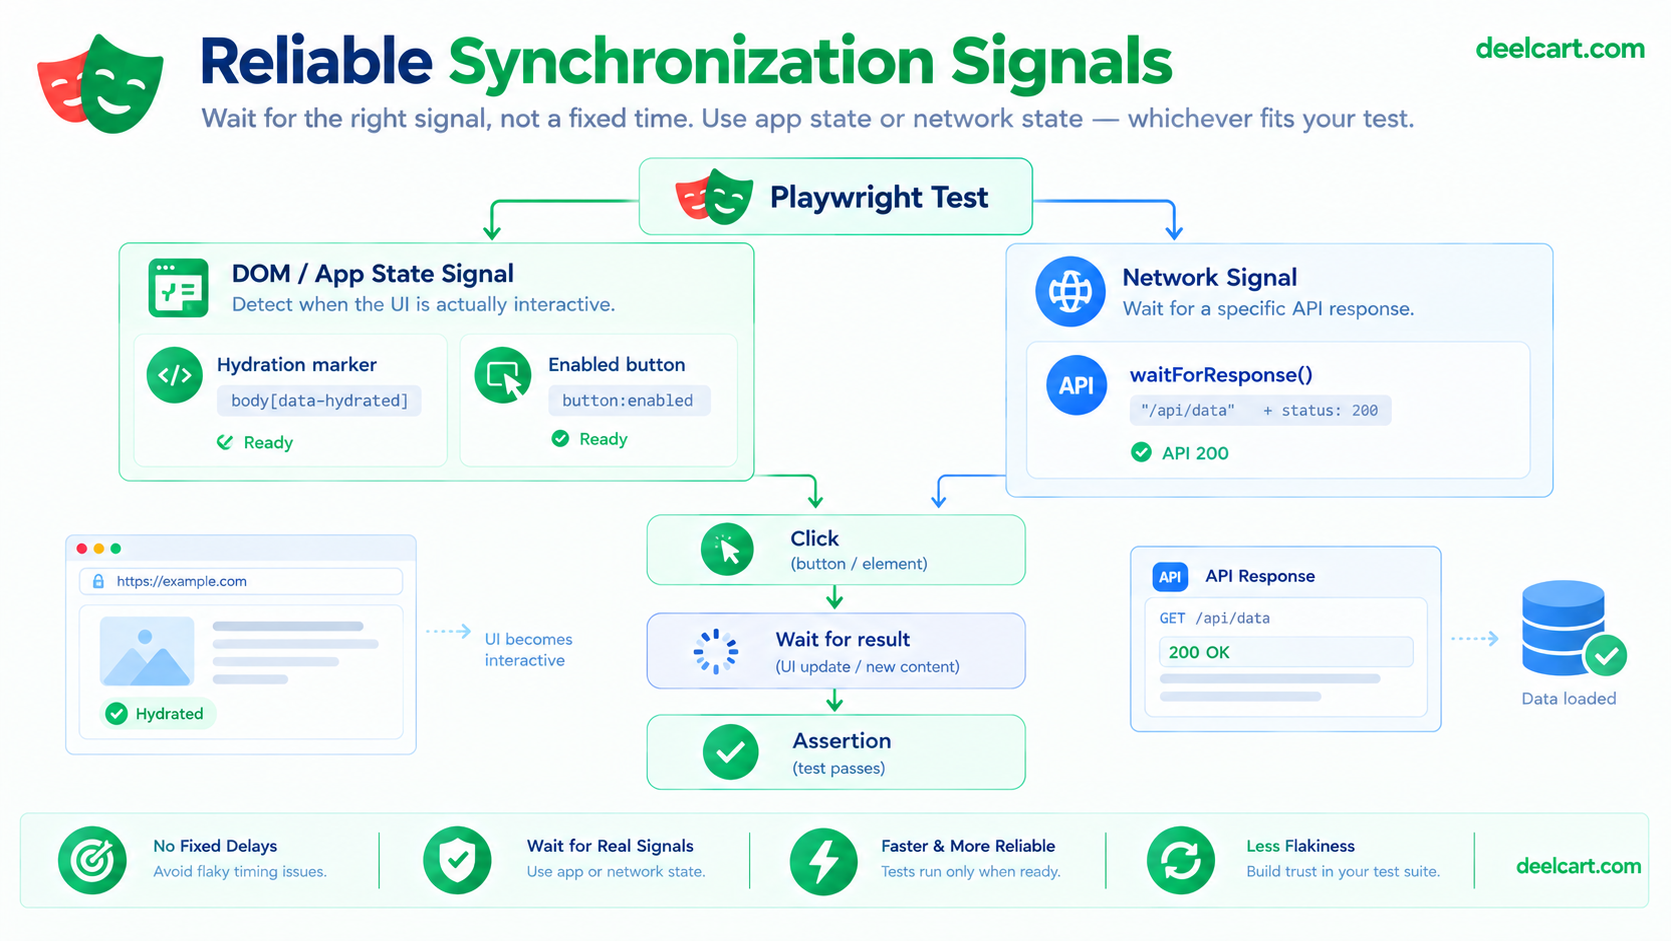
The lesson is that "the page is hydrated" isn't one fact on a streaming page. It's a separate fact for each boundary.
The Real Fix: One Marker Per Boundary
Give each streamed section its own readiness signal. A small component takes an id and sets a matching attribute when it hydrates:
// components/ReadyMarker.tsx
'use client';
import { useEffect } from 'react';

export default function ReadyMarker({ id }: { id: string }) {
  useEffect(() => {
    document.body.setAttribute(`data-ready-${id}`, 'true');
    return () => document.body.removeAttribute(`data-ready-${id}`);
  }, [id]);
  return null;
}
Place it inside the boundary it describes. Because it's part of the suspended content, it only renders once the data resolves, and its effect only runs once that boundary has hydrated:
<Suspense fallback={<p>Loading stats…</p>}>
  <SlowStats />
  <ReadyMarker id="stats" />
</Suspense>
The cleanup function matters. If the boundary suspends again later (after a navigation or a refetch), the attribute is removed, so a test can't mistake stale readiness for the real thing.
Now wrap the wait in a small helper so every test uses it the same way:
// tests/helpers/ready.ts
import { Page } from '@playwright/test';

export async function waitForReady(page: Page, ...ids: string[]) {
  await page.locator('body[data-hydrated="true"]').waitFor({ state: 'attached' });
  for (const id of ids) {
    await page.locator(`body[data-ready-${id}="true"]`).waitFor({ state: 'attached' });
  }
}
And the test states exactly what it depends on:
import { test, expect } from '@playwright/test';
import { waitForReady } from './helpers/ready';

test('refresh updates the stats panel', async ({ page }) => {
  await page.goto('/dashboard');
  await waitForReady(page, 'stats');

  await page.getByRole('button', { name: 'Refresh' }).click();
  await expect(page.getByText('Updated just now')).toBeVisible();
});
A test that only needs the Export button can skip the stats marker and run immediately, so the slow section doesn't slow down tests that don't touch it. That's the benefit over simply waiting longer.
Why page.goto Doesn't Help
By default, page.goto resolves on the load event. That tells you the document and its resources finished loading. It says nothing about whether React has hydrated a given boundary, and with streaming the interesting work happens after the initial HTML. Don't treat a returned goto as "ready", and don't swap it for waitUntil: 'networkidle' either, which can fire before JavaScript finishes executing and may never fire on pages with polling.
Reproduce It on Demand
The most useful debugging step is making the problem happen deliberately. The 3-second delay in the demo above is one way: it turns an intermittent race into a consistent failure for any test that clicks the stats panel too early. If the flake only appears on slow CI runners, slow your local browser down to match. Playwright on Chromium can throttle the network and CPU through the DevTools protocol:
const client = await page.context().newCDPSession(page);

await client.send('Network.emulateNetworkConditions', {
  offline: false,
  latency: 400,
  downloadThroughput: (500 * 1024) / 8,
  uploadThroughput: (500 * 1024) / 8,
});

await client.send('Emulation.setCPUThrottlingRate', { rate: 4 });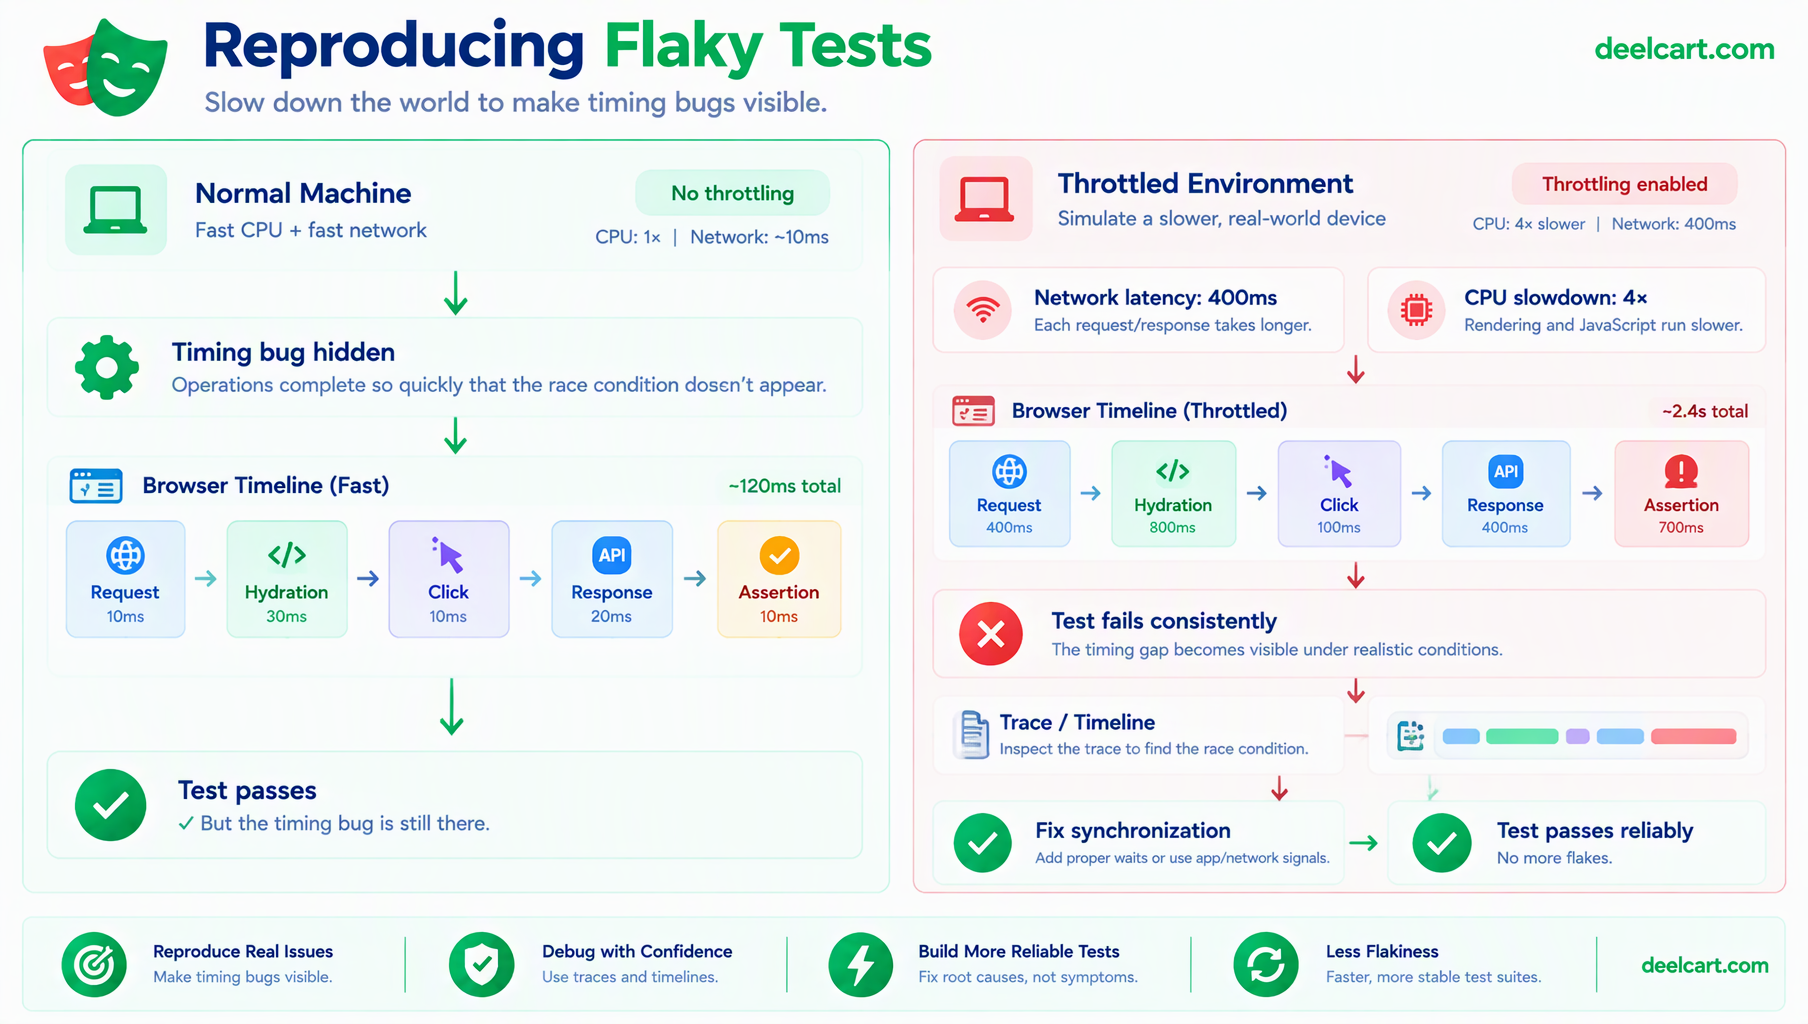
With a 400 millisecond latency and a 4x CPU slowdown, a test with a hidden timing assumption fails consistently on your own machine, which turns a one-in-ten mystery into something you can fix and verify. If a layout jumps while content streams in, that's a separate problem I cover in debugging layout shifts with Playwright.
Use Web-First Assertions for the Rest
Once the right markers have passed, the remaining timing is about the result of an action. Use web-first assertions, which retry until they pass or time out, instead of reading a value once:
// Flaky: reads the text once, right now
const text = await page.locator('.status').textContent();
expect(text).toBe('Saved');

// Reliable: retries until the text matches or the timeout expires
await expect(page.locator('.status')).toHaveText('Saved');
When the signal is the network call itself, wait for the specific response, and register the listener before the click so a fast response can't arrive first:
const responsePromise = page.waitForResponse(
  (res) => res.url().includes('/api/save') && res.status() === 200
);
await page.getByRole('button', { name: 'Save' }).click();
const response = await responsePromise;
expect(response.ok()).toBeTruthy();
Configuration That Helps Without Hiding Problems
Two settings in playwright.config.ts earn their place, with one warning:
import { defineConfig } from '@playwright/test';

export default defineConfig({
  retries: process.env.CI ? 2 : 0,
  use: {
    trace: 'on-first-retry',
    actionTimeout: 10000,
  },
  expect: { timeout: 7000 },
});
Retries in CI stop a single network hiccup from failing a whole pipeline, and trace: 'on-first-retry' records a full trace of exactly the run that failed, which shows what the page was doing when the test acted. The warning: retries are a safety net, not a fix. A test that only passes on its second attempt has a real timing bug, and retries just hide it. I treat any test that needed a retry as something to investigate. If you run these tests on a schedule, a failure alert like the one in my uptime monitoring script saves you from noticing a red pipeline days late.
Frequently Asked Questions
Why not just increase the global timeout?
A longer timeout only lets a slow step take longer before failing. It doesn't fix a test that acts too early, because clicking before hydration doesn't time out, it silently does nothing or triggers default browser behavior. The fix is waiting for the right condition, not waiting longer.
Does waiting for the network to go idle solve hydration problems?
Not reliably. Network idle means no requests are in flight, which can happen before the JavaScript has finished executing, and pages with polling or analytics may never go fully idle. A marker set by the app itself is a far more precise signal than inferring readiness from traffic.
Do I need a marker on every component?
No. Add one per Suspense boundary that contains something a test interacts with. Sections that are purely display (text, images) don't need one, and tests should only wait for the markers they actually depend on.
Will the markers affect production?
They're a few bytes of client JavaScript and a body attribute. If you'd rather not ship them, render the ReadyMarker components only when an environment variable such as NEXT_PUBLIC_E2E is set, and build your test environment with it on.
Is a fixed timeout ever acceptable?
Rarely, and only as a small bounded settle step after the real waiting logic has already done its job. Using it as the primary synchronization mechanism is what produces suites that are both slow and flaky.
How do I find which tests are flaky in a large suite?
Run the suite repeatedly, either with the repeat option in your runner or by re-running CI several times on the same commit. Any test that fails inconsistently on identical code has a timing dependency. Combined with the trace files from retried runs, that gives you a concrete list of what to fix first. For pages that load content as you scroll, the same idea applies, and I cover it in handling infinite scroll in Playwright.
Justin is a self-taught developer who builds and runs DeelCart himself — from the articles to the server it runs on. He manages his own Linux infrastructure and writes guides based on tools and workflows he actually uses day to day.