Handling Content Layout Shifts (CLS): Debugging and Fixing Core Web Vitals with Playwright
What CLS Actually Measures
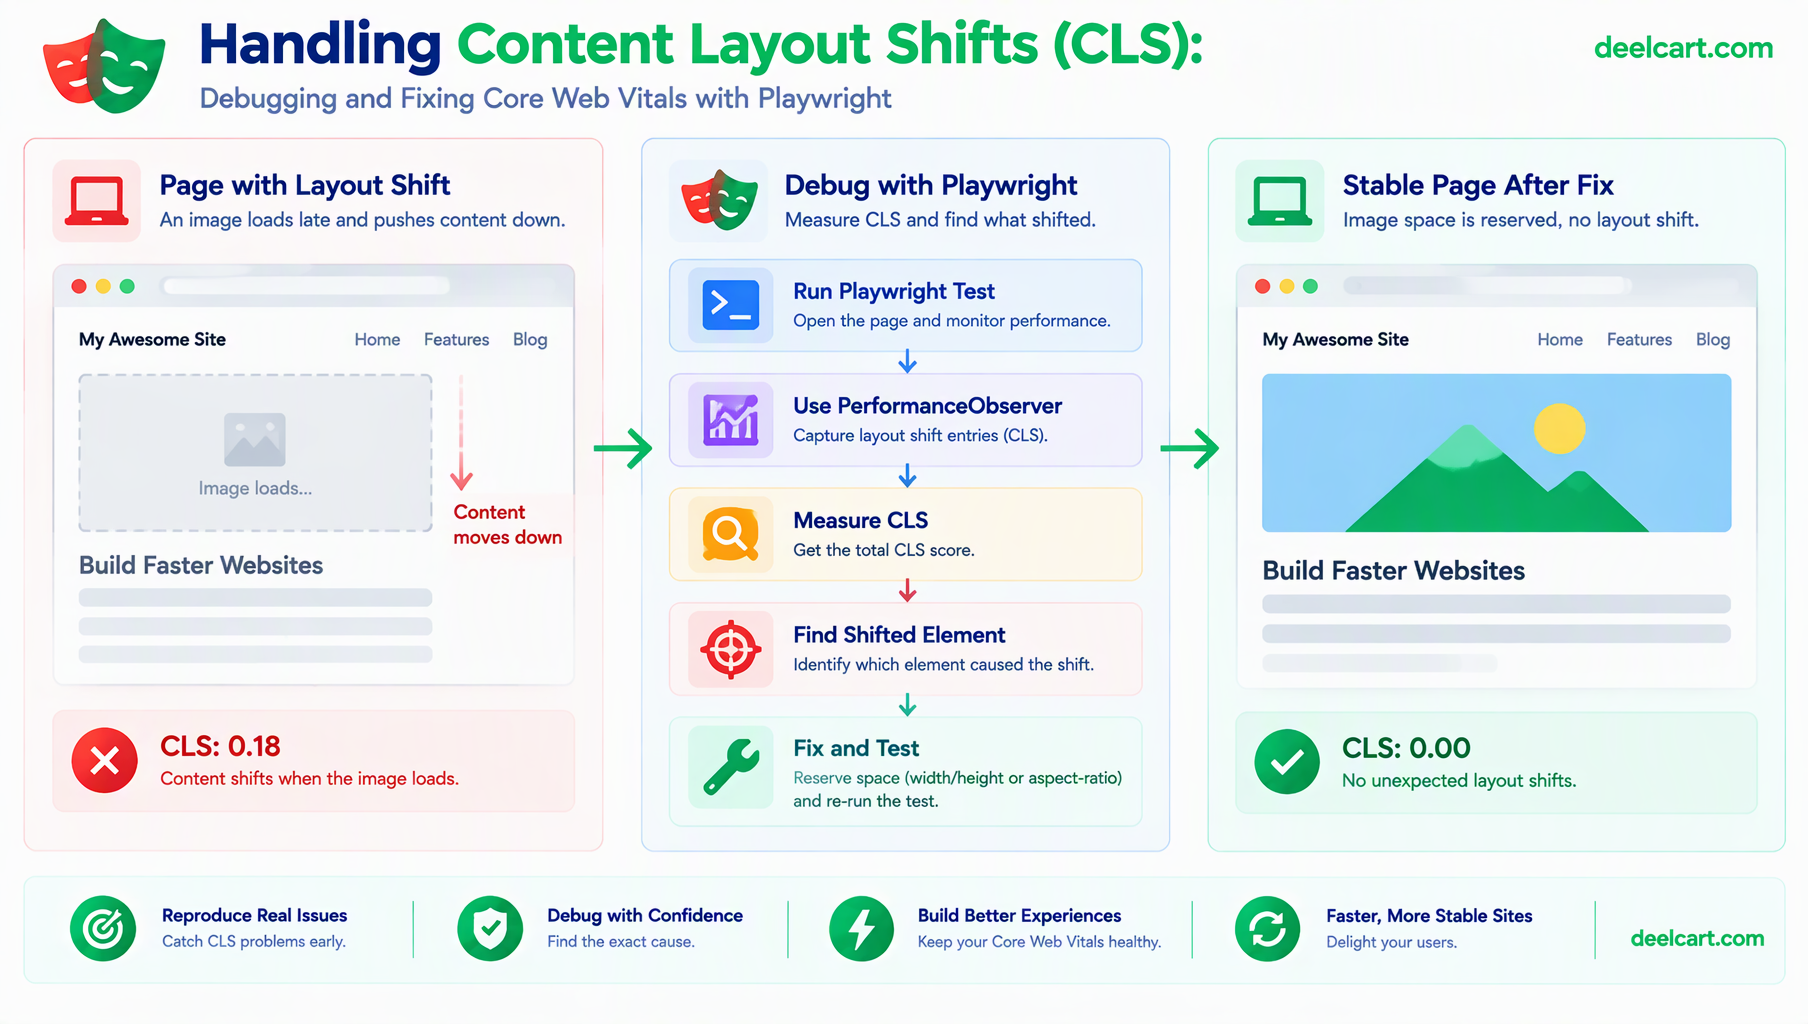
Cumulative Layout Shift is a Core Web Vital that scores how much visible content moves unexpectedly while a page is loading and being used. Every time an element shifts position between two rendered frames, the browser calculates a score for that shift based on how much of the viewport was affected and how far things moved, and CLS is the sum of the worst cluster of those shifts during the page's lifetime.
A low score doesn't mean nothing moved — it means nothing moved in a way that would disorient someone reading or about to click something. A high score usually means one specific, findable cause: an image loading in without reserved space, a web font swap that changes text width, or something injected into the page above content that's already visible.
The Browser API Behind the Score
The score isn't a black box Google computes somewhere else — it comes from the Layout Instability API, which is available directly through PerformanceObserver in any browser that supports it. This is the same primitive PageSpeed Insights and Lighthouse read from, which means a Playwright test can read the exact same numbers during an actual page load:
async function measureCLS(page: Page): Promise<number> {
  return page.evaluate(() => {
    return new Promise<number>((resolve) => {
      let clsValue = 0;

      const observer = new PerformanceObserver((list) => {
        for (const entry of list.getEntries() as any[]) {
          if (!entry.hadRecentInput) {
            clsValue += entry.value;
          }
        }
      });

      observer.observe({ type: 'layout-shift', buffered: true });

      // Give the page a window to finish its initial shifts before reading
      setTimeout(() => {
        observer.disconnect();
        resolve(clsValue);
      }, 3000);
    });
  });
}
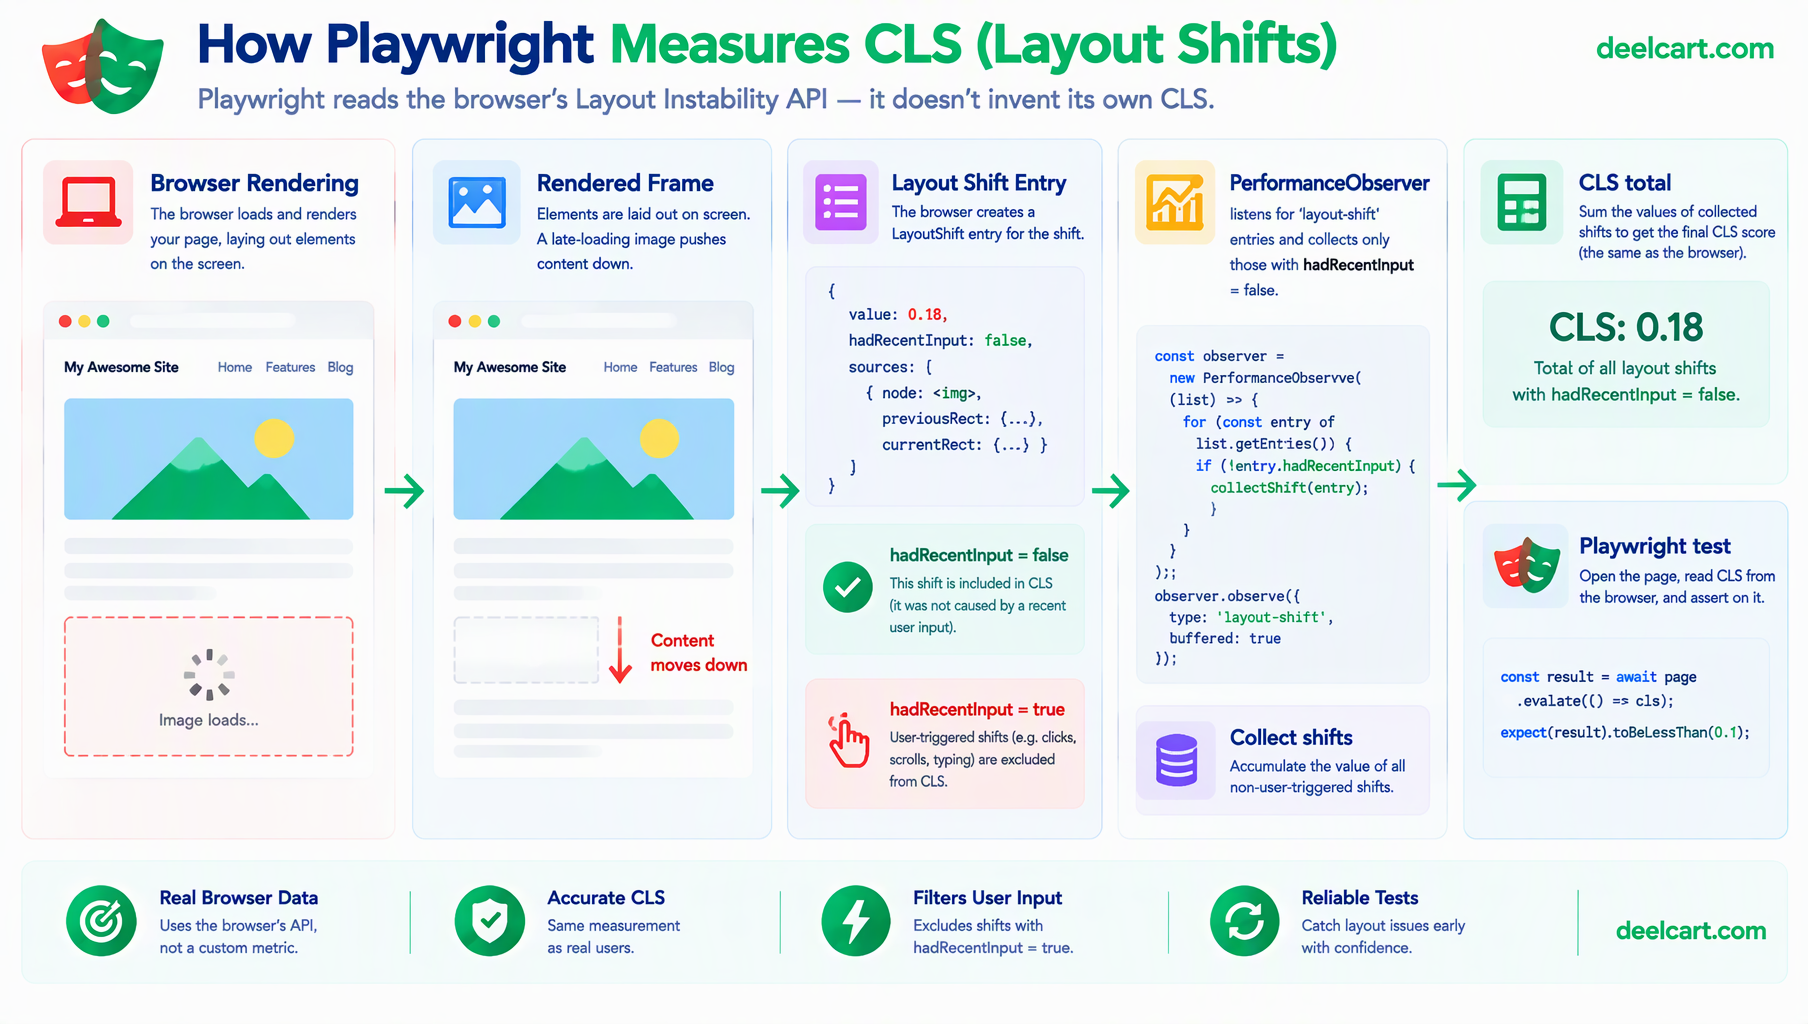
hadRecentInput matters here — a layout change caused directly by something the user just clicked or tapped isn't a bad experience, it's an expected reaction to their own action, so the API excludes it from the score by design. Filtering it out here matches how the real metric is calculated, rather than inflating the number with shifts nobody would actually be bothered by.
Turning It Into a Failing Test
Measuring the number is only useful if it can actually block a regression before it ships. Wrapped in a Playwright test with a threshold, a layout shift over budget fails the build the same way a broken assertion would:
import { test, expect, type Page } from '@playwright/test';

test('homepage CLS stays under budget', async ({ page }) => {
  await page.goto('/');

  const cls = await measureCLS(page);

  // 0.1 is the commonly cited "good" threshold for CLS
  expect(cls).toBeLessThan(0.1);
});
This is the actual value of doing this in Playwright rather than only checking PageSpeed Insights after deploying: a regression gets caught in CI, against the real rendered page, before it's live — not discovered days later when a performance scan happens to flag it.
Finding What Actually Moved
A failing number tells you something shifted, not what. For that, the API's sources field names the specific elements involved in each shift:
const shiftSources = await page.evaluate(() => {
  return new Promise<string[]>((resolve) => {
    const sources: string[] = [];
    const observer = new PerformanceObserver((list) => {
      for (const entry of list.getEntries() as any[]) {
        if (entry.hadRecentInput) continue;
        for (const source of entry.sources || []) {
          sources.push(source.node?.tagName + (source.node?.className ? `.${source.node.className}` : ''));
        }
      }
    });
    observer.observe({ type: 'layout-shift', buffered: true });
    setTimeout(() => { observer.disconnect(); resolve(sources); }, 3000);
  });
});

console.log('Elements involved in shifts:', shiftSources);
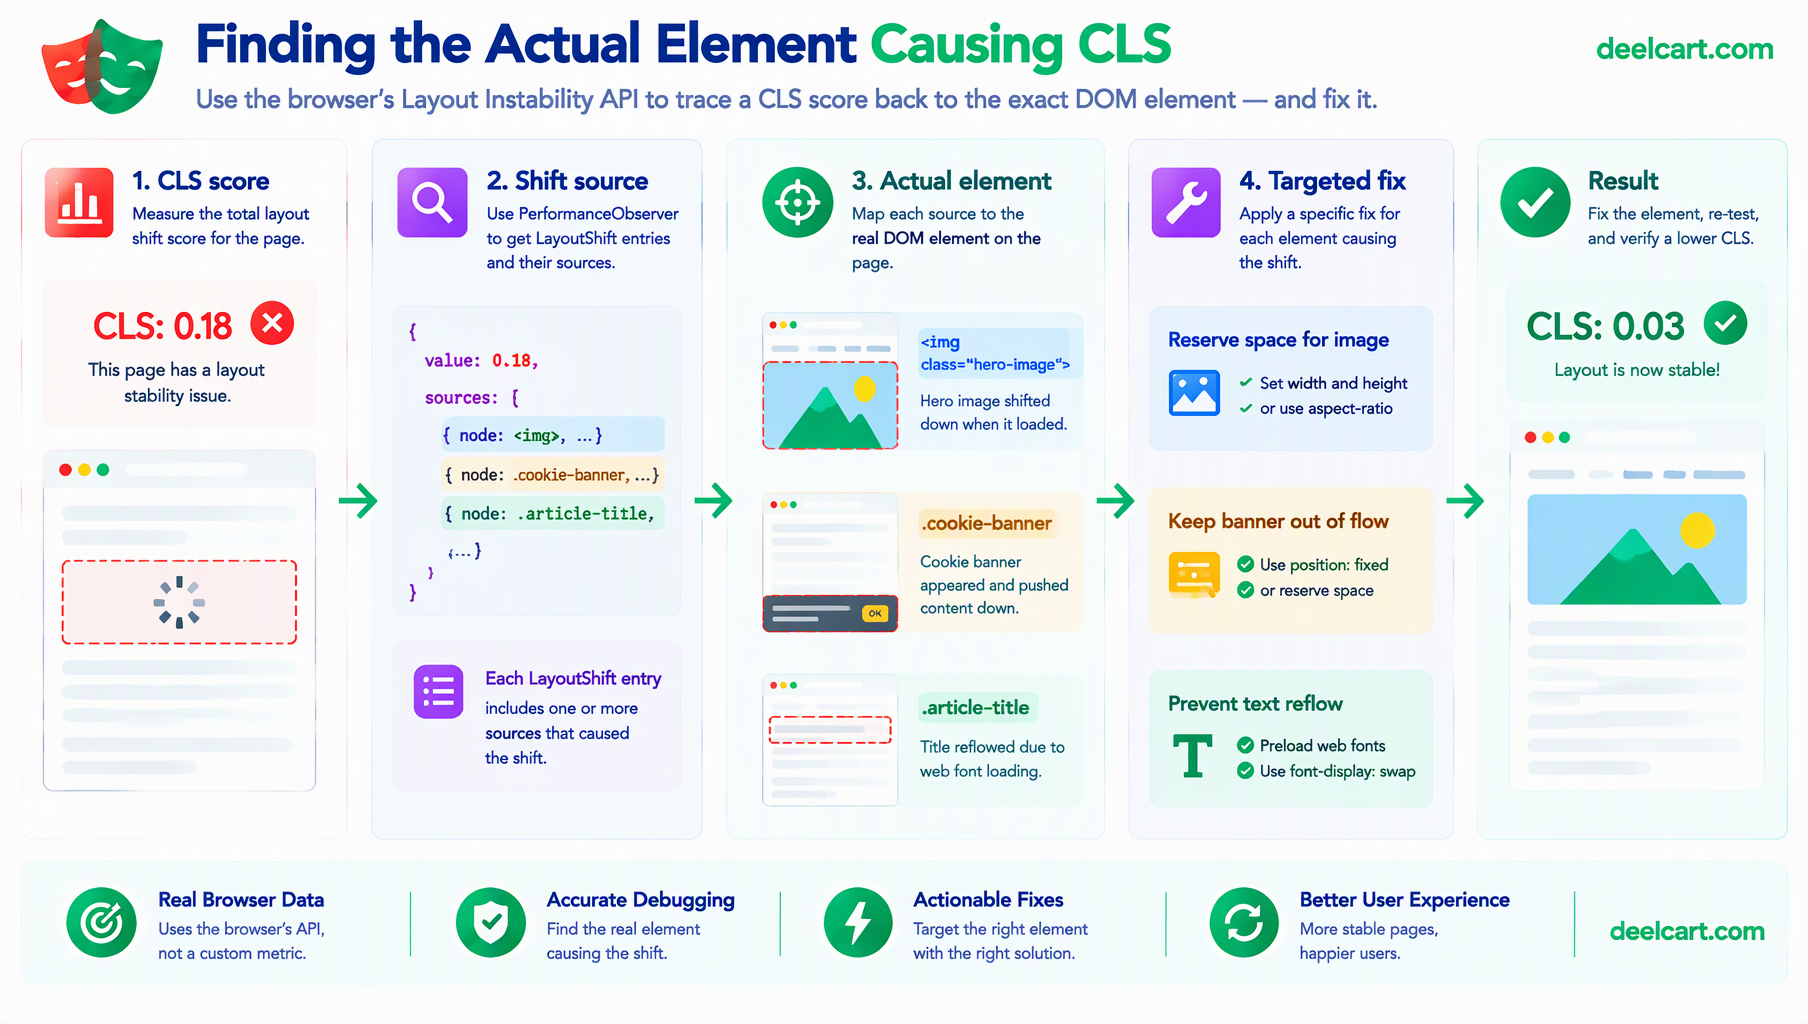
This turns "the page has a 0.18 CLS score" into "the shift came from this specific image and this specific banner," which is the difference between guessing at fixes and actually knowing what to fix.
The Common Causes, and the Actual Fixes
Once the source elements are identified, the fixes tend to fall into a small number of recurring categories, covered in more depth in web.dev's guide to optimizing CLS:
Images without reserved space. An <img> with no explicit width and height (or no aspect-ratio set) takes up zero space until it loads, then shoves everything below it down the moment it does. Setting explicit dimensions — even just the correct aspect ratio — reserves the space up front so nothing has to move when the image arrives.
Web fonts swapping in. A fallback font renders at a different width than the real one, and when the real font finishes loading, text reflows. font-display: optional avoids the swap entirely at the cost of occasionally staying on the fallback font; size-adjust in a @font-face block can shrink the visual difference between fallback and real font instead.
Content injected above existing content. A banner, a cookie notice, or an ad that loads in and pushes everything below it down is one of the most disruptive shift patterns, specifically because it moves content a reader may already be looking at or about to click. Reserving space for it up front, the same way as an image, is the fix — not preventing it from loading, but not letting its arrival move anything else.
Watching It Happen, Not Just Measuring It
A number and a list of element tag names is often enough to fix the issue. When it isn't — when the interaction between several things loading close together makes the actual cause unclear — Playwright's trace viewer records a full visual timeline of a test run, including DOM snapshots at each point in time:
npx playwright test --trace on
npx playwright show-trace trace.zip
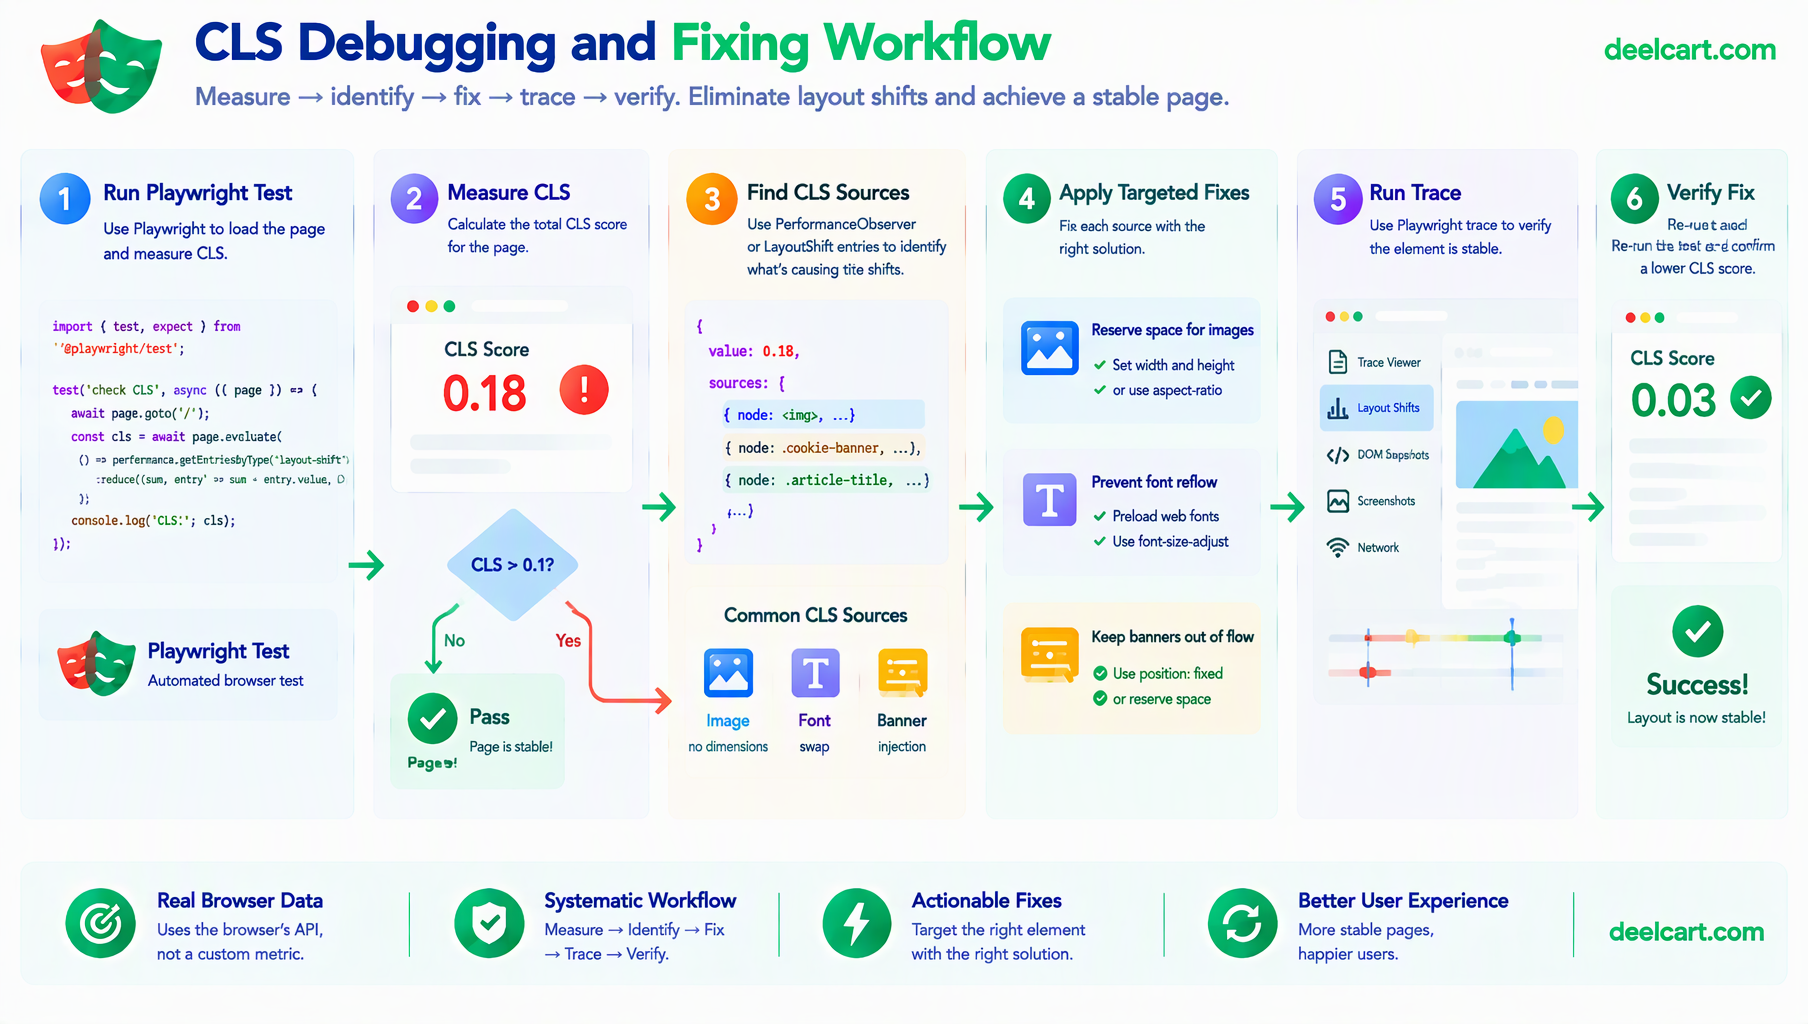
Scrubbing through the recorded snapshots makes a shift that was too fast to see in a live browser easy to catch frame by frame after the fact — the exact problem that started this whole investigation.
Lab Data Isn't the Whole Picture
A Playwright test runs in a controlled environment with a fast connection and no real-world interference, which is exactly what makes it reliable for catching regressions — and exactly why it can miss things that only show up for actual visitors. PageSpeed Insights reports both this kind of lab data and real field data collected from actual Chrome users, and the two disagreeing is itself useful information: it usually means something is happening after the initial page load, on a slower connection, or during a specific interaction pattern that a controlled test never exercises. A Playwright check is what stops an obvious regression from shipping; field data is what tells you whether real visitors are still experiencing something the lab test doesn't reproduce.
Frequently Asked Questions
Should this test run on every page or just a few key ones?
Start with the pages that get the most traffic or where a bad first impression matters most — a homepage, a landing page, a product or article template. Layout shift issues are often shared across every page using the same template, so catching it on one representative page frequently catches the same bug everywhere that template is used.
Why exclude shifts caused by user input?
Because they're not the problem CLS is meant to catch. A user opening an accordion or submitting a form and seeing the page respond is expected, intentional behavior, not a disorienting surprise. The hadRecentInput flag is exactly what the real metric uses to make this same distinction, so filtering it out keeps a Playwright measurement consistent with what PageSpeed Insights and Lighthouse would actually report.
Is 0.1 the right threshold for every project?
0.1 is the widely cited "good" threshold, but nothing stops you from setting a stricter budget for a page where visual stability matters even more — a checkout flow, for instance. What matters is picking a number and actually enforcing it as a build gate, rather than treating CLS as something to check manually after the fact.
Does fixing CLS in a Playwright test guarantee a good real-world score?
It guarantees the specific scenario the test exercises doesn't regress. Real users load pages on a wider range of devices, connections, and viewport sizes than a single automated test covers, which is exactly why checking field data periodically alongside the automated test — rather than relying on either one alone — gives the fuller picture.
Justin is a self-taught developer who builds and runs DeelCart himself — from the articles to the server it runs on. He manages his own Linux infrastructure and writes guides based on tools and workflows he actually uses day to day.