Writing a Custom Bash Script to Monitor Server Uptime and Send Discord/Slack Webhook Alerts
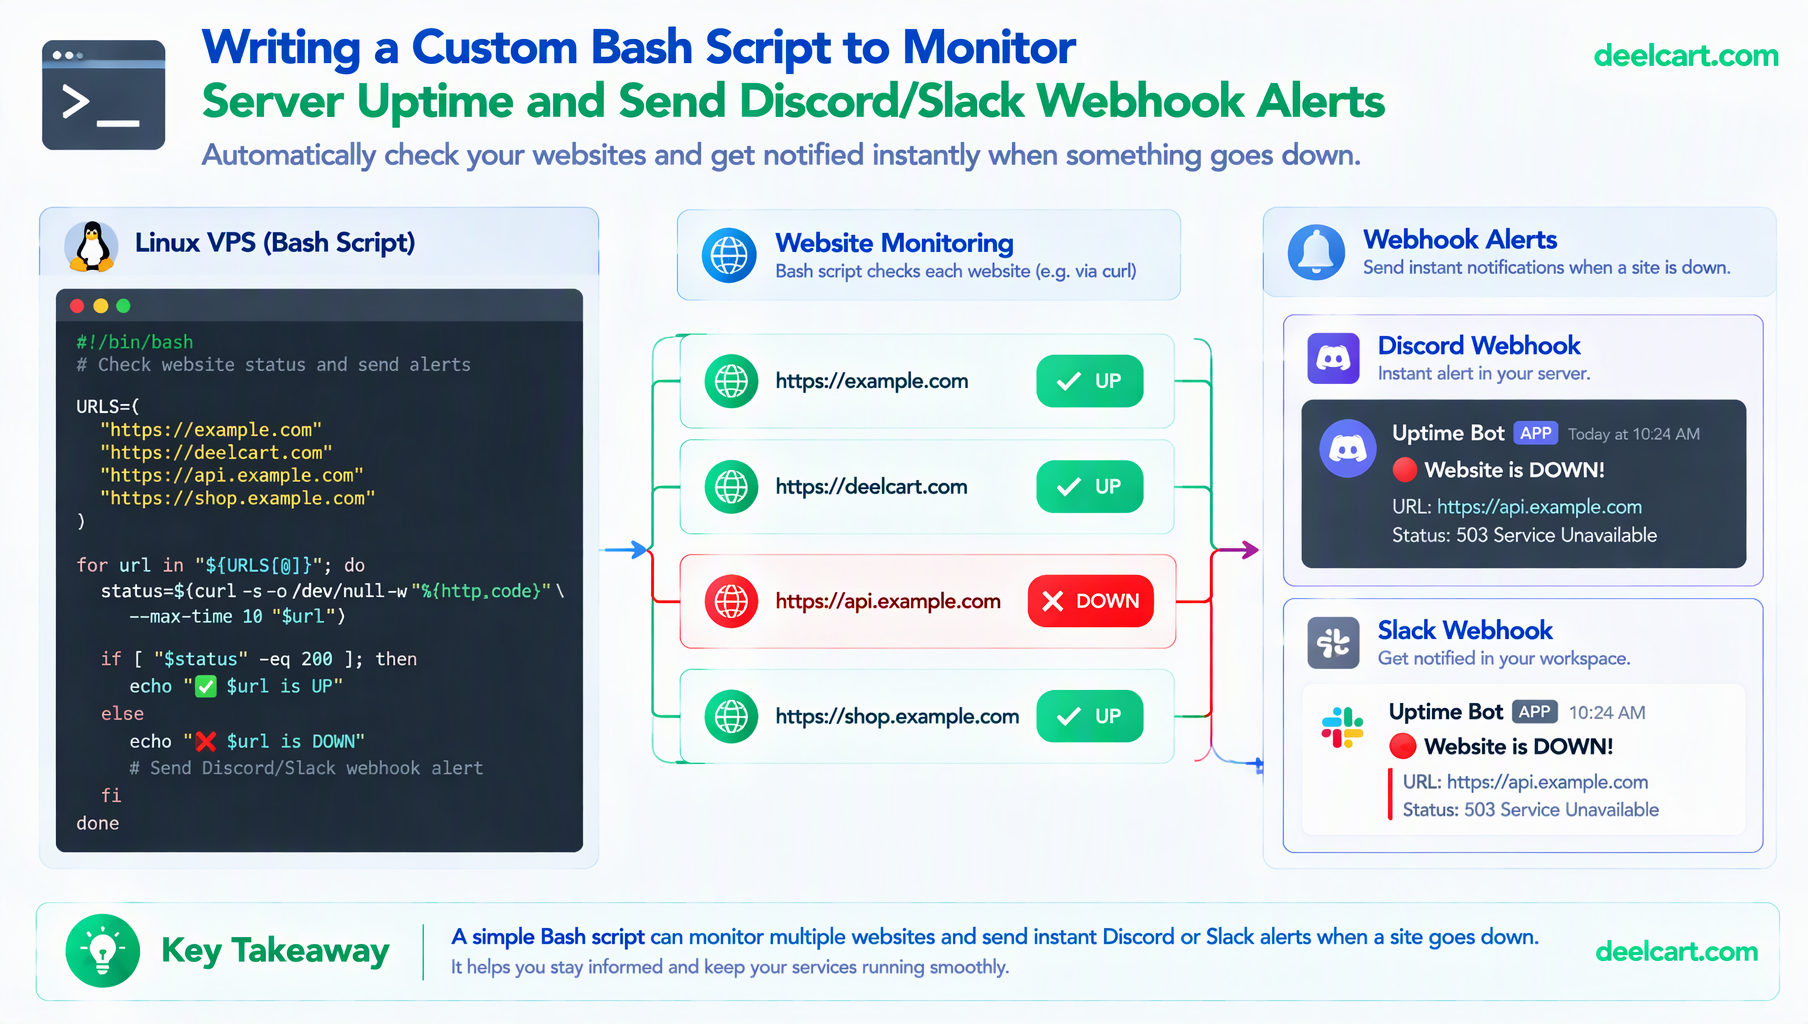
The version in this article is the second iteration. The first one worked, but it had gaps I only found by testing failures on purpose: overlapping runs, hand-built JSON that breaks on a stray quote, and no answer at all to the question "who monitors the monitor?" I've fixed all three, and I ran the final script against a local test server to confirm it sends exactly one alert when a site goes down and one when it recovers.
What This Script Actually Does, and What It Doesn't
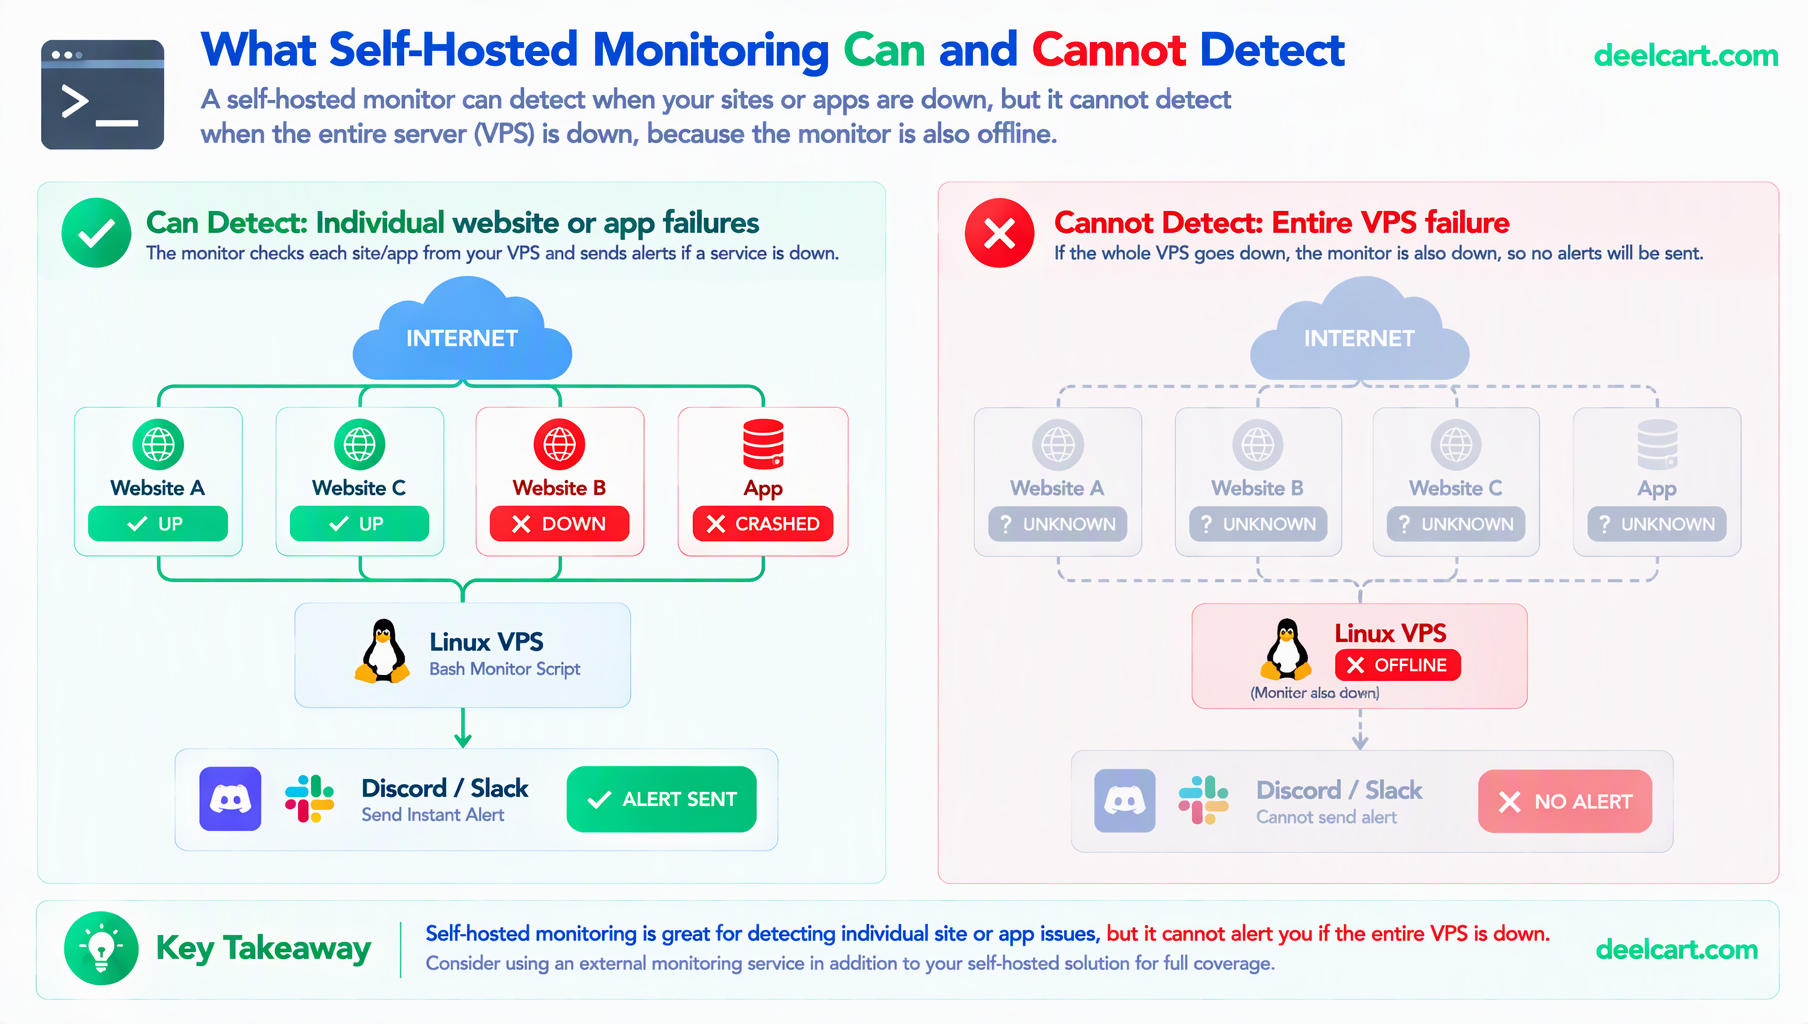
Before the implementation, the honest limitation: this script runs on the same server it's monitoring. If the entire droplet goes down, not just one app crashing but the whole machine, the monitoring script goes down with it and sends nothing. That's a real gap, and it's the specific thing a proper external uptime service (checking from a different network entirely) catches that a self-hosted script structurally cannot. What this script does cover well is the much more common case: one specific app on the server crashing, hanging, or returning errors while the rest of the server keeps running fine, which is exactly what happened to me.
There's a cheap way to close most of that gap, covered in the heartbeat section below.
The Core Check
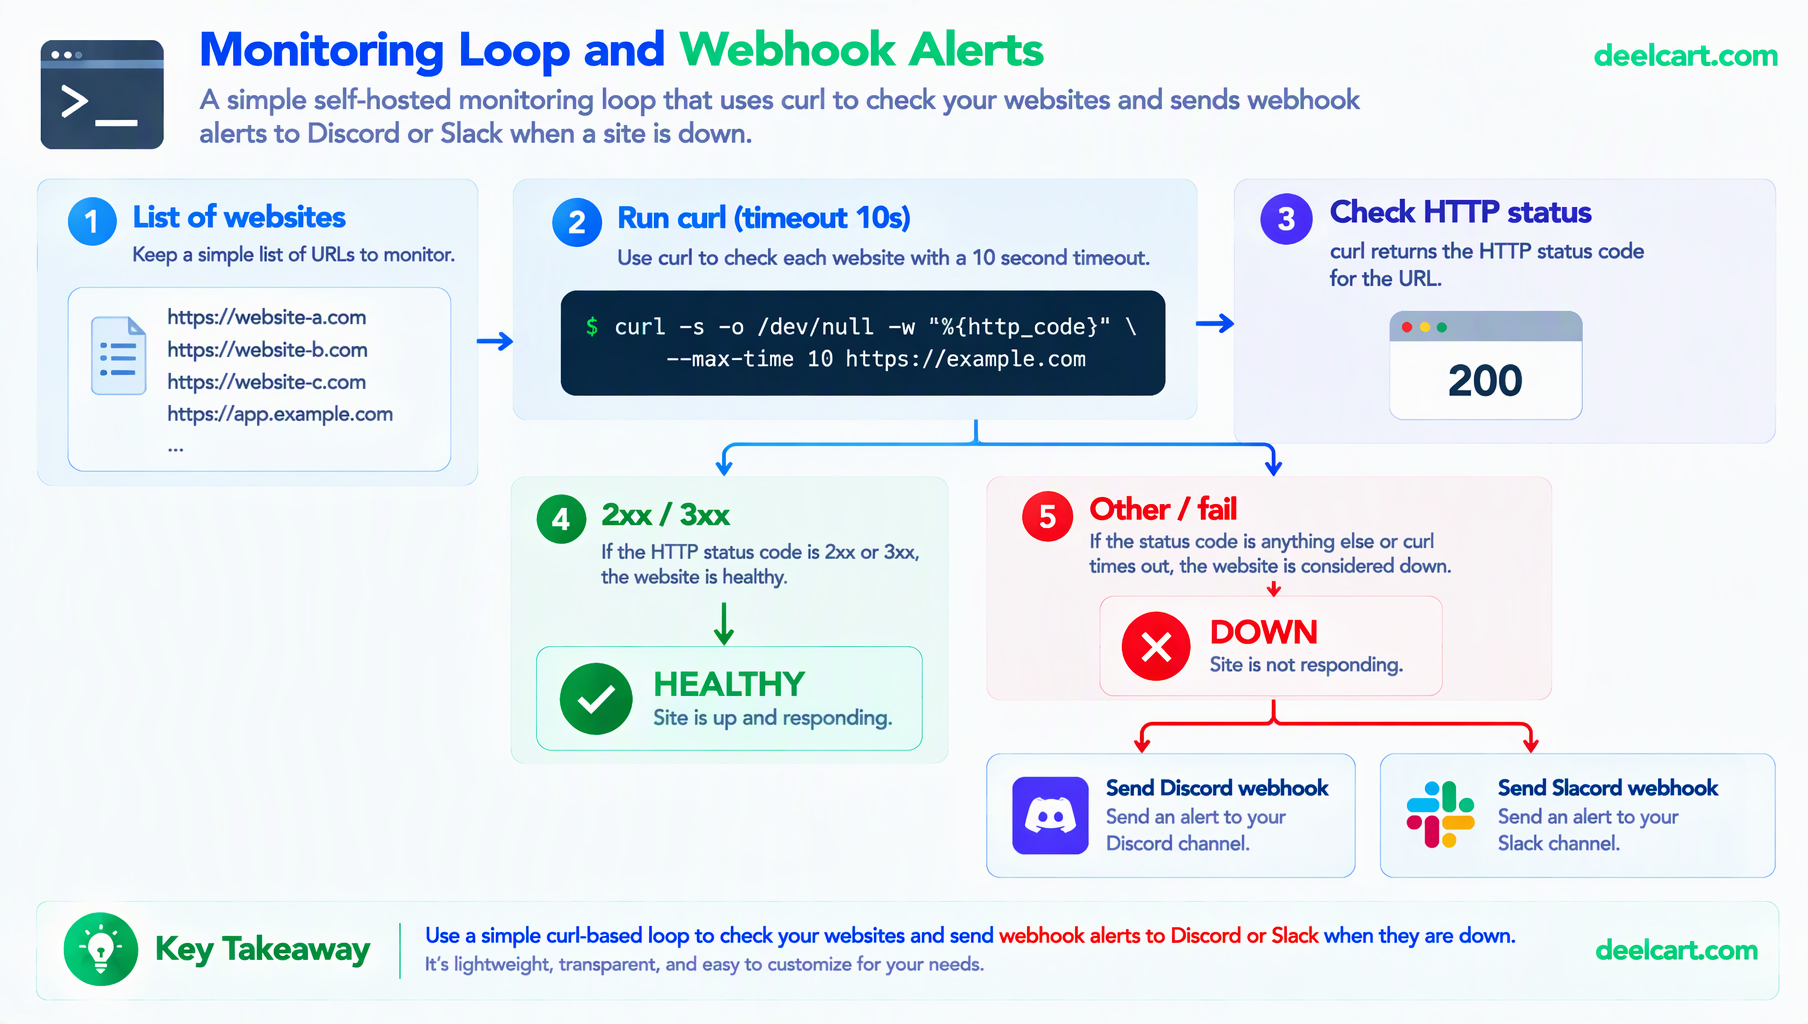
The script loops over a list of domains and checks each one with curl, using its exit code and timeout handling rather than trying to parse output:
#!/bin/bash

SITES=(
  "https://example-a.com"
  "https://example-b.com"
  "https://example-c.com"
)

check_site() {
  local url=$1
  local status
  status=$(curl -s -o /dev/null -w "%{http_code}" --max-time 10 "$url")
  echo "$status"
}

for site in "${SITES[@]}"; do
  code=$(check_site "$site")
  echo "$site -> $code"
done
-o /dev/null discards the response body since only the status matters here, -w "%{http_code}" prints just the numeric status code, and --max-time 10 ensures a hung connection doesn't leave the whole check stuck indefinitely. A site that's timing out should count as down, not stall the script forever.
One detail I got wrong in my first draft: when a connection fails outright or times out, curl doesn't print a blank. It prints 000. That's convenient, because it means every outcome is a number you can compare. Any code in the 2xx or 3xx range counts as healthy; anything else, including 000, counts as down. In the final script I also add -L so curl follows redirects and judges the page you actually end up on, rather than the redirect itself.
Check Something Smarter Than the Homepage
A homepage returning 200 doesn't prove the app works. A Next.js page can render from cache while the database connection is dead. A dedicated health endpoint fixes that by returning 200 only when its dependencies respond:
// app/api/health/route.ts
import { NextResponse } from 'next/server';
import mongoose from 'mongoose';
import { dbConnect } from '@/lib/db';

export const dynamic = 'force-dynamic'; // never cache a health check

export async function GET() {
  try {
    await dbConnect();
    const db = mongoose.connection.db;
    if (!db) throw new Error('no database handle');
    await db.admin().ping();
    return NextResponse.json({ status: 'ok' });
  } catch {
    return NextResponse.json({ status: 'error' }, { status: 503 });
  }
}
Point the monitor at /api/health instead of /. When MongoDB dies or the connection pool is exhausted, this returns 503 and the monitor alerts, even though the homepage might still look fine. I use this approach for the same reason I run an index audit on the database: failures that don't look like failures from the outside are the dangerous ones.
Sending the Actual Alert
Both Discord and Slack accept a simple POST with a JSON body to a webhook URL, with no SDK and no auth flow beyond the URL itself staying private. Discord's webhook format expects a content field:
send_discord_alert() {
  local message=$1
  curl -s -X POST "$DISCORD_WEBHOOK_URL" \
    -H "Content-Type: application/json" \
    -d "{\"content\": \"$message\"}"
}
Slack's incoming webhook format is nearly identical, using text instead of content:
send_slack_alert() {
  local message=$1
  curl -s -X POST "$SLACK_WEBHOOK_URL" \
    -H "Content-Type: application/json" \
    -d "{\"text\": \"$message\"}"
}
Both webhook URLs should live in a separate file that's never committed to a repository, because anyone with the raw URL can post messages into that channel. The final script reads them from /etc/uptime-monitor.env, which you lock down with chmod 600.
The snippets above build JSON by pasting the message into a string. That works until a message contains a double quote or backslash, at which point the JSON is invalid and the alert silently never arrives. The final script escapes those two characters before sending, which is enough for the plain-text messages it generates.
Avoiding Alert Spam on a Single Blip
The naive version alerts the instant one check fails, which means a single slow response or a momentary network blip fires off a false alarm. Worse, without any state between runs, a site that's genuinely down gets a fresh duplicate alert on every single cron run, which trains you to start ignoring the channel entirely. Two fixes, both necessary:
Require consecutive failures before alerting, using a small state file per site to track how many checks in a row have failed. The alert fires exactly once, when the counter reaches the threshold, and a matching recovery message fires once when the site comes back:
STATE_DIR="/var/tmp/uptime-monitor"
mkdir -p "$STATE_DIR"

for site in "${SITES[@]}"; do
  code=$(check_site "$site")
  state_file="$STATE_DIR/$(echo "$site" | md5sum | cut -d' ' -f1)"
  fail_count=$(cat "$state_file" 2>/dev/null || echo 0)

  if [[ "$code" -ge 200 && "$code" -lt 400 ]]; then
    if [[ "$fail_count" -ge 3 ]]; then
      send_discord_alert "✅ RECOVERED: $site is back up (HTTP $code)"
      send_slack_alert "✅ RECOVERED: $site is back up (HTTP $code)"
    fi
    echo 0 > "$state_file"
  else
    fail_count=$((fail_count + 1))
    echo "$fail_count" > "$state_file"
    if [[ "$fail_count" -eq 3 ]]; then
      send_discord_alert "🔴 DOWN: $site returned HTTP $code (3 consecutive failures)"
      send_slack_alert "🔴 DOWN: $site returned HTTP $code (3 consecutive failures)"
    fi
  fi
done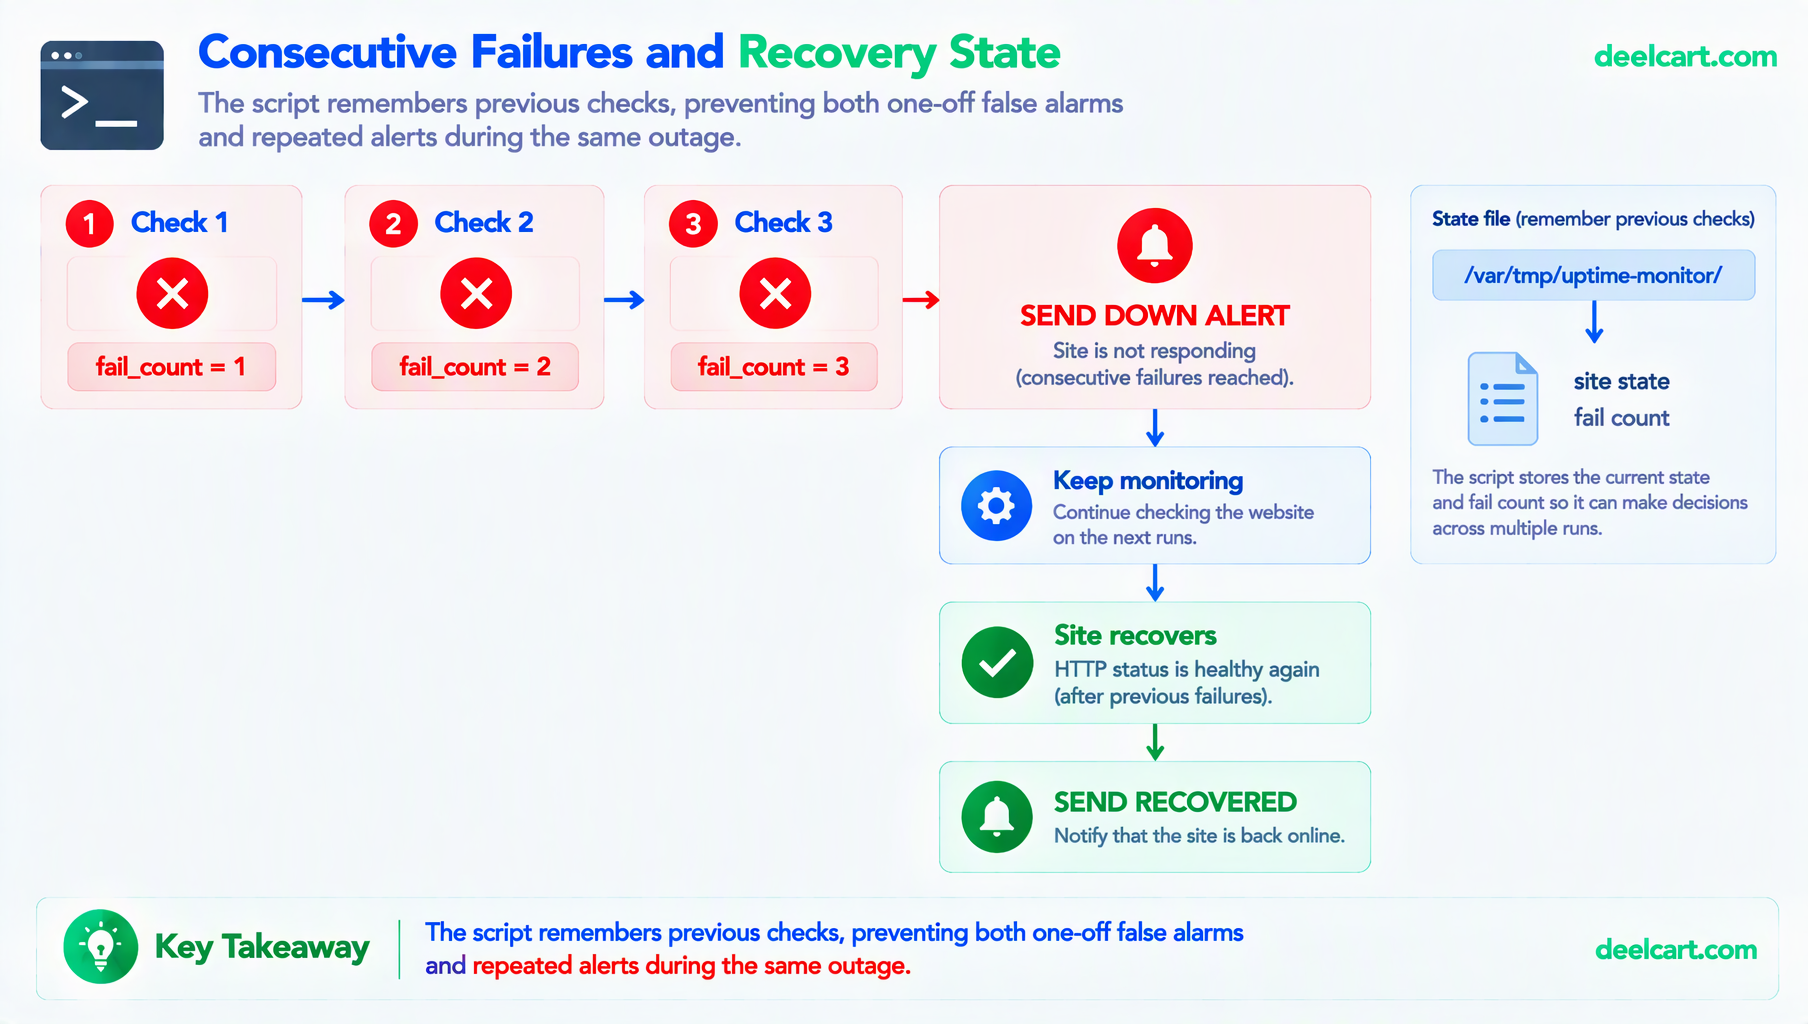
Requiring three consecutive failures (rather than alerting on the first one) absorbs a single transient blip without absorbing a genuine outage. Three failed checks in a row at a two-minute interval means the site has been unhealthy for around four to six minutes, which is a real problem, not noise. The recovery message matters as much as the down alert, since otherwise you're left checking manually to find out if it ever recovered.
Who Monitors the Monitor? A Heartbeat
This is the fix for the limitation at the top. The idea is a dead man's switch: at the end of every successful run, the script pings an external URL. If those pings stop arriving, that external service alerts you. It catches the cases the script can't report itself: the whole droplet is down, cron stopped, or the script crashed before finishing.
Healthchecks.io is built for exactly this: you create a check with an expected schedule, it gives you a ping URL, and it emails or messages you when a ping is late. Any similar service works the same way. The script just needs one line at the end:
curl -fsS -m 10 --retry 3 "$HEARTBEAT_URL" > /dev/nullBecause the check lives on someone else's infrastructure, it covers the "entire droplet is down" case that a purely self-hosted script structurally can't.
Don't Let Runs Overlap
If a run takes longer than the cron interval (several slow sites, each waiting out a 10-second timeout), the next run starts while the previous one is still going, and both read and write the same state files. The fix is a lock. flock is part of util-linux and available on essentially every Linux server:
exec 9>"$STATE_DIR/.lock"
flock -n 9 || exit 0   # another run is still in progress, skip this one
The Complete Script
Here's everything together. Save it as /usr/local/bin/uptime-monitor.sh:
#!/usr/bin/env bash
# uptime-monitor.sh - checks sites, alerts Discord/Slack after N consecutive failures,
# sends one recovery alert, and pings an external heartbeat so you learn if the monitor itself dies.
set -u

ENV_FILE="${ENV_FILE:-/etc/uptime-monitor.env}"   # holds DISCORD_WEBHOOK_URL, SLACK_WEBHOOK_URL, HEARTBEAT_URL
[ -f "$ENV_FILE" ] && . "$ENV_FILE"

SITES=(
  "https://example-a.com/api/health"
  "https://example-b.com"
  "https://example-c.com"
)
FAIL_THRESHOLD="${FAIL_THRESHOLD:-3}"
MAX_TIME="${MAX_TIME:-10}"
STATE_DIR="${STATE_DIR:-/var/tmp/uptime-monitor}"
mkdir -p "$STATE_DIR"

# Never let two runs overlap
exec 9>"$STATE_DIR/.lock"
flock -n 9 || exit 0

json_escape() { printf '%s' "$1" | sed -e 's/\\/\\\\/g' -e 's/"/\\"/g'; }

alert() {
  local msg
  msg=$(json_escape "$1")
  if [ -n "${DISCORD_WEBHOOK_URL:-}" ]; then
    curl -s -m 10 -X POST "$DISCORD_WEBHOOK_URL" -H "Content-Type: application/json" \
      -d "{\"content\":\"$msg\"}" > /dev/null
  fi
  if [ -n "${SLACK_WEBHOOK_URL:-}" ]; then
    curl -s -m 10 -X POST "$SLACK_WEBHOOK_URL" -H "Content-Type: application/json" \
      -d "{\"text\":\"$msg\"}" > /dev/null
  fi
  return 0
}

# Prints the final HTTP status after following redirects; prints 000 if the request failed or timed out
check_site() {
  curl -s -o /dev/null -L -w "%{http_code}" --max-time "$MAX_TIME" "$1"
}

for site in "${SITES[@]}"; do
  code=$(check_site "$site")
  key=$(printf '%s' "$site" | md5sum | cut -d' ' -f1)
  state_file="$STATE_DIR/$key"
  fails=$(cat "$state_file" 2>/dev/null || echo 0)

  if [[ "$code" =~ ^[0-9]+$ ]] && (( 10#$code >= 200 && 10#$code < 400 )); then
    if (( fails >= FAIL_THRESHOLD )); then
      alert "✅ RECOVERED: $site is back up (HTTP $code)"
    fi
    fails=0
  else
    fails=$((fails + 1))
    if (( fails == FAIL_THRESHOLD )); then
      alert "🔴 DOWN: $site returned HTTP $code ($FAIL_THRESHOLD consecutive failures)"
    fi
  fi

  echo "$fails" > "$state_file"
  echo "$(date -Is) $site HTTP $code fails=$fails"
done

# Heartbeat: if these pings ever stop arriving, the external service alerts you
if [ -n "${HEARTBEAT_URL:-}" ]; then
  curl -fsS -m 10 --retry 3 "$HEARTBEAT_URL" > /dev/null
fi
Create the secrets file and lock it down:
sudo tee /etc/uptime-monitor.env > /dev/null <<'EOF'
DISCORD_WEBHOOK_URL="https://discord.com/api/webhooks/..."
SLACK_WEBHOOK_URL="https://hooks.slack.com/services/..."
HEARTBEAT_URL="https://hc-ping.com/your-uuid"
EOF
sudo chmod 600 /etc/uptime-monitor.env
sudo chmod +x /usr/local/bin/uptime-monitor.sh
Leave out any line you don't use. An empty or missing webhook is skipped rather than causing an error.
Scheduling It
A tight interval matters here, since the whole point is catching downtime quickly rather than discovering it an hour later. Every two minutes via cron is a reasonable balance between responsiveness and not hammering sites with constant requests:
*/2 * * * * /usr/local/bin/uptime-monitor.sh >> /var/log/uptime-monitor.log 2>&1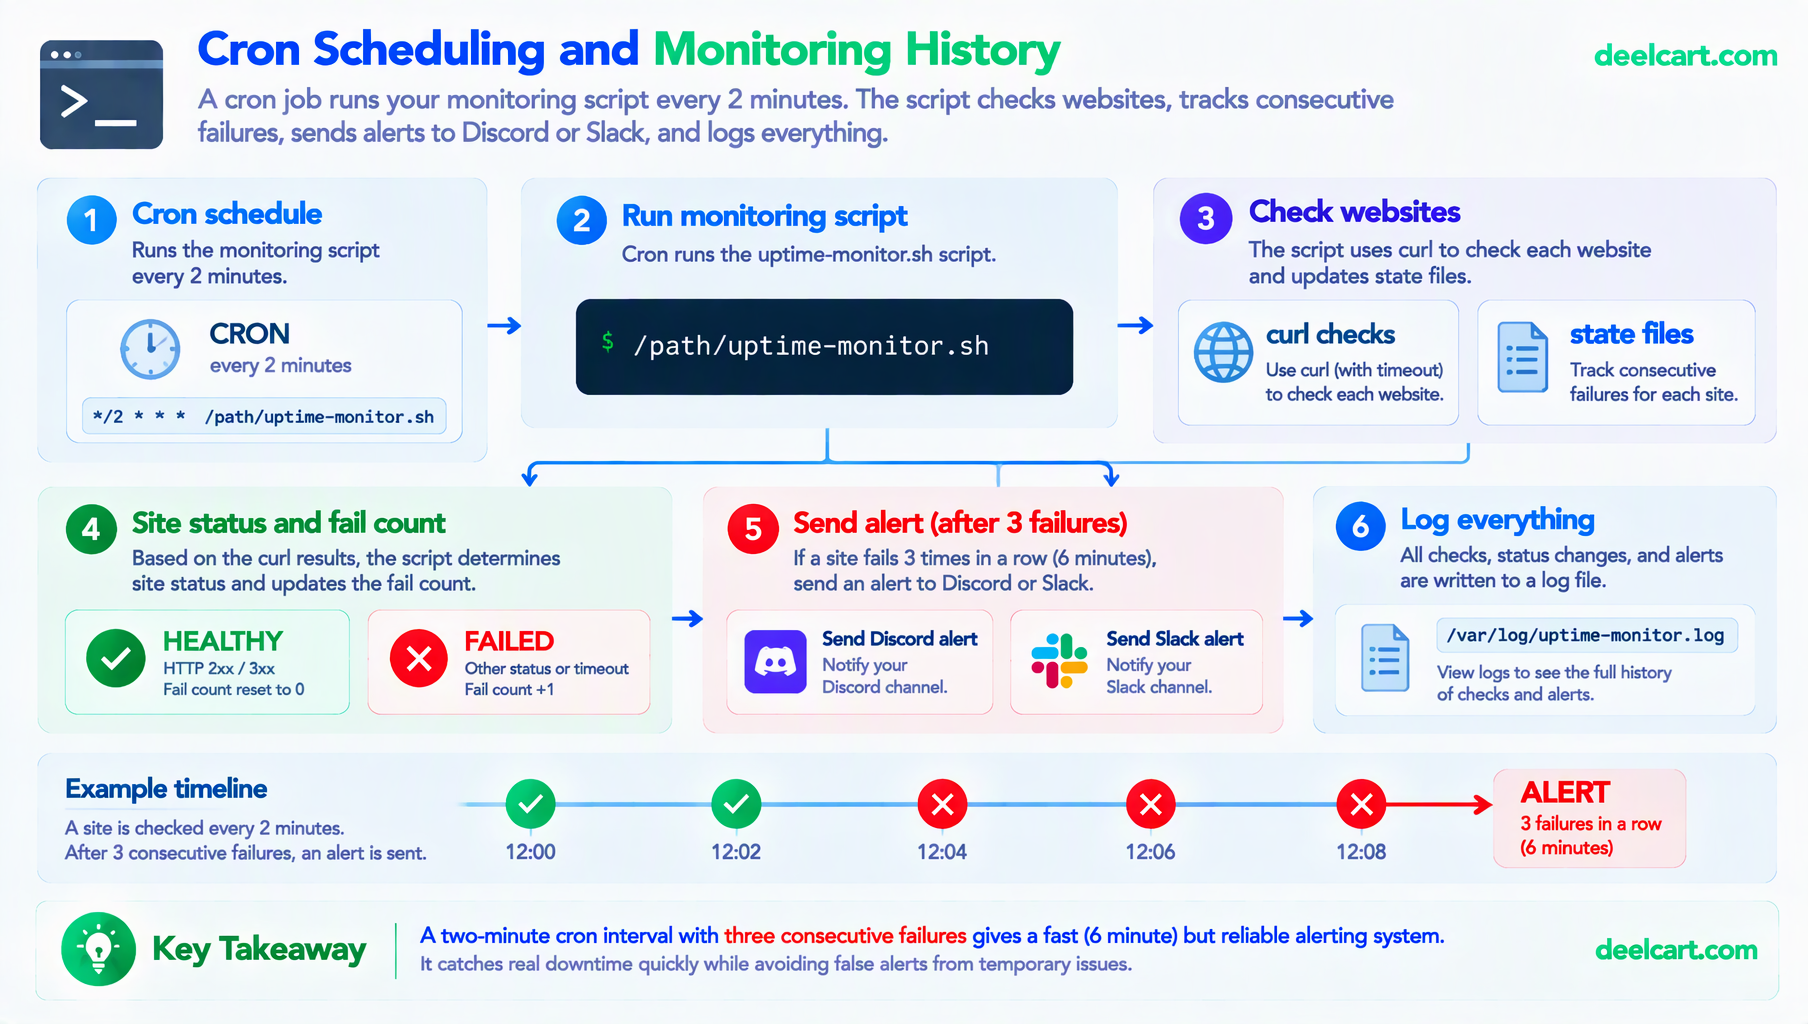
Each run logs one line per site with a timestamp, status code and the current failure count. That gives you a plain history to check when debugging the monitor itself, useful for confirming the script is actually running on schedule, separate from whether any site it's checking is up or down. Log files grow, so give this one the same rotation treatment as your other logs; I cover the approach in configuring log rotation for PM2.
Test That It Alerts Before You Trust It
Never assume a monitor works. Test it by making something fail deliberately. Add a URL you know returns an error, such as a page that doesn't exist on one of your own sites, to the SITES array, then run the script by hand three times:
/usr/local/bin/uptime-monitor.sh
/usr/local/bin/uptime-monitor.sh
/usr/local/bin/uptime-monitor.sh   # the DOWN alert should arrive here, exactly once
Run it a fourth and fifth time and confirm no further alerts arrive. Then remove the bad URL, run it once more, and confirm a single RECOVERED message. If you get a duplicate DOWN message, or nothing at all, you've found a bug before an outage did.
Extending It: Slow Responses and Certificate Expiry
The same loop handles other checks by swapping the check function. To catch a site that's technically up but slow, ask curl for the total time as well as the status:
read -r code secs <<< "$(curl -s -o /dev/null -L -w '%{http_code} %{time_total}' --max-time 10 "$site")"
if awk -v t="$secs" 'BEGIN { exit !(t > 3.0) }'; then
  echo "$site is slow: ${secs}s"
fi
To get warned before a TLS certificate expires, compute the days remaining. This pairs well with automated Let's Encrypt renewals, because it tells you if renewal quietly stopped working:
cert_days_left() {
  local host=$1 end
  end=$(echo | openssl s_client -servername "$host" -connect "$host:443" 2>/dev/null \
        | openssl x509 -noout -enddate | cut -d= -f2)
  [ -z "$end" ] && { echo -1; return; }
  echo $(( ( $(date -d "$end" +%s) - $(date +%s) ) / 86400 ))
}
Alert when the result drops below, say, 14. A -1 means the check itself failed, which is worth an alert too.
Frequently Asked Questions
Why not just use a free tier of an existing uptime service?
For a handful of personal sites, the free tiers of most uptime services genuinely work and are worth considering. The honest reason to build this instead is wanting full control over the check logic (exact timeout behavior, custom alert thresholds, which endpoint gets checked) and not wanting another third-party account to manage. For anything beyond a personal project, a dedicated external service is usually the better call specifically because it checks from outside your own infrastructure. The heartbeat approach in this article is a middle path: you keep your own checks and add one external dependency purely as a safety net.
Should this check more than just the homepage of each site?
Yes. Checking a specific health-check endpoint, one that confirms the database connection is alive and not just that the web server responds, catches more failure modes than a homepage check alone. A server can return a cached page or a generic error page with a 200 status in some misconfigurations, which a plain status-code check on the homepage would miss entirely.
What's the actual cost of running this?
Essentially nothing beyond a few seconds of CPU time every two minutes and a tiny amount of bandwidth. It comfortably runs alongside everything else on the same small server being monitored without any noticeable resource impact. Locking down who can log into that server matters just as much, so see securing SSH access on a public VPS if you haven't already.
What if the alert itself fails to send?
A failed webhook call is silent in this script by design, so one bad request can't take down the whole run. That's why the heartbeat and the log file are both worth having: the log shows the failure count that should have triggered an alert, and the external heartbeat tells you if the whole thing stopped. If you want stronger guarantees, add a second channel such as email through your provider's SMTP relay.
Could this be extended to check more than just HTTP status?
Yes. The same pattern extends to response time, SSL certificate expiry (both shown above), or specific content appearing on the page to confirm it's not just technically up but actually rendering correctly. Each of those is the same core loop with a different check function.
Justin is a self-taught developer who builds and runs DeelCart himself — from the articles to the server it runs on. He manages his own Linux infrastructure and writes guides based on tools and workflows he actually uses day to day.